


InstaSpot टीम में लीजेंड!
लीजेंड! आपको लगता है कि धमाकेदार बयानबाजी है? लेकिन हमें एक आदमी को कैसे बुलाना चाहिए, जो 18 साल की जूनियर विश्व शतरंज चैंपियनशिप जीतने वाला पहला एशियाई बना और 19 में पहला भारतीय ग्रैंडमास्टर कौन बना? यह विश्वनाथन आनंद के लिए विश्व चैंपियन खिताब के लिए एक कठिन मार्ग की शुरुआत थी, जो उस व्यक्ति के लिए हमेशा के लिए शतरंज का इतिहास बन गया। अब InstaSpot टीम में एक और लीजेंड!


बोरूसिया जर्मनी में सबसे अधिक शीर्षक वाले फुटबॉल क्लबों में से एक है, जो प्रशंसकों के लिए बार-बार साबित हुआ है: प्रतियोगिता और नेतृत्व की भावना निश्चित रूप से सफलता की ओर ले जाएगी। उसी तरह से व्यापार जिसमें खेल पेशेवर खेल खेलते हैं: आत्मविश्वास से और सक्रिय रूप से। बोरूसिया FC से एक "पास" रखें और InstaSpot के साथ नेतृत्व में रहें!

[Gold]
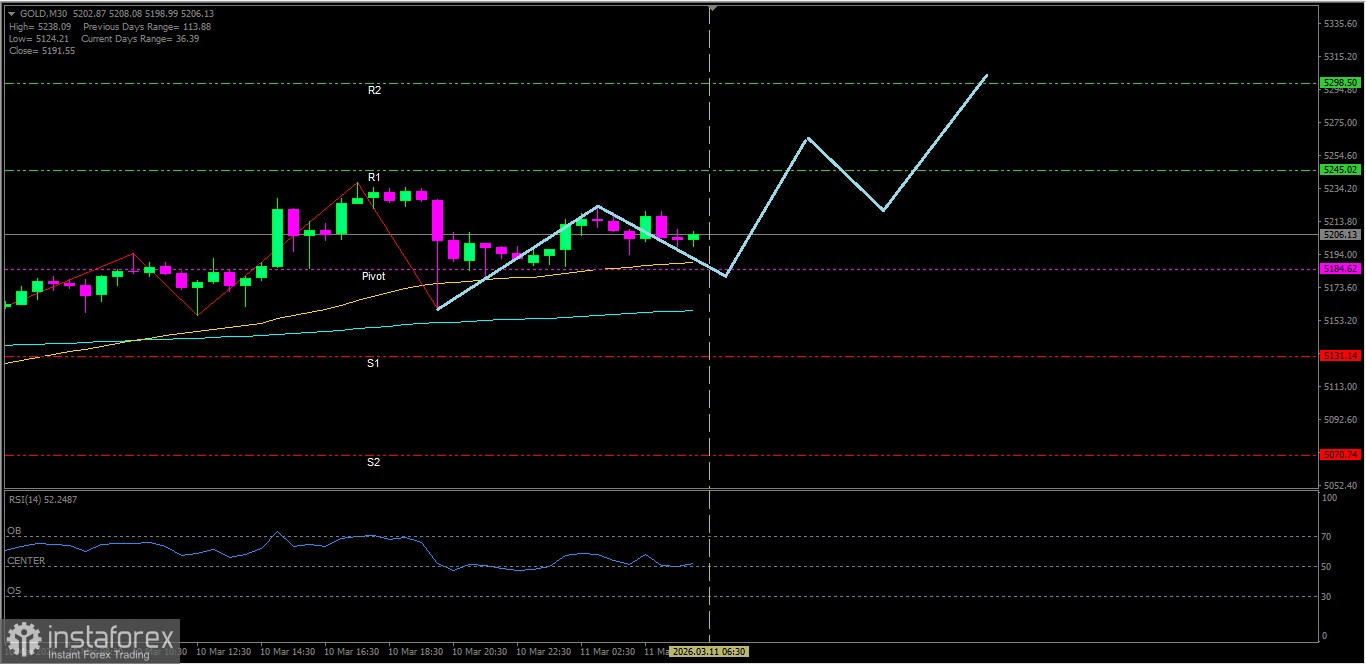
With EMA(50) and EMA(200) condition in a Golden Cross intersection and RSI(14) indicator in the Neutral-Bullish area, then Gold is likely to test its nearest resistance level in the near term.
Key Levels
1. Resistance. 2 : 5298.50
2. Resistance. 1 : 5245.02
3. Pivot : 5184.62
4. Support. 1 : 5131.14
5. Support. 2 : 5070.74
Tactical Scenario
Positive Reaction Zone: If the price holds at 5184.62, Gold is likely to move up toward 5245.02.
Momentum Extension Bias: If 5245.02 is broken, Gold could continue higher to test 5298.50.
Invalidation Level / Bias Revision
The upside bias weakens if Gold falls below 5070.74.
Technical Summary
EMA(50) : 5188.51
EMA(200): 5159.06
RSI(14) : 50.54
Economic News Release Agenda:
Today the United States will release the following economic data:
US - Core CPI m/m - 19:30 WIB
US - CPI m/m - 19:30 WIB
US - CPI y/y - 19:30 WIB
US - Crude Oil Inventories - 21:30 WIB
US - 10-y Bond Auction - 00:01 WIB
US - Federal Budget Balance - 01:00 WIB
*यहां पर लिखा गया बाजार विश्लेषण आपकी जागरूकता बढ़ाने के लिए किया है, लेकिन व्यापार करने के लिए निर्देश देने के लिए नहीं |
InstaSpot analytical reviews will make you fully aware of market trends! Being an InstaSpot client, you are provided with a large number of free services for efficient trading.


