


Our team has over 7,000,000 traders!
Every day we work together to improve trading. We get high results and move forward.
Recognition by millions of traders all over the world is the best appreciation of our work! You made your choice and we will do everything it takes to meet your expectations!
We are a great team together!
InstaSpot. Proud to work for you!


Actor, UFC 6 tournament champion and a true hero!
The man who made himself. The man that goes our way.
The secret behind Taktarov's success is constant movement towards the goal.
Reveal all the sides of your talent!
Discover, try, fail - but never stop!
InstaSpot. Your success story starts here!

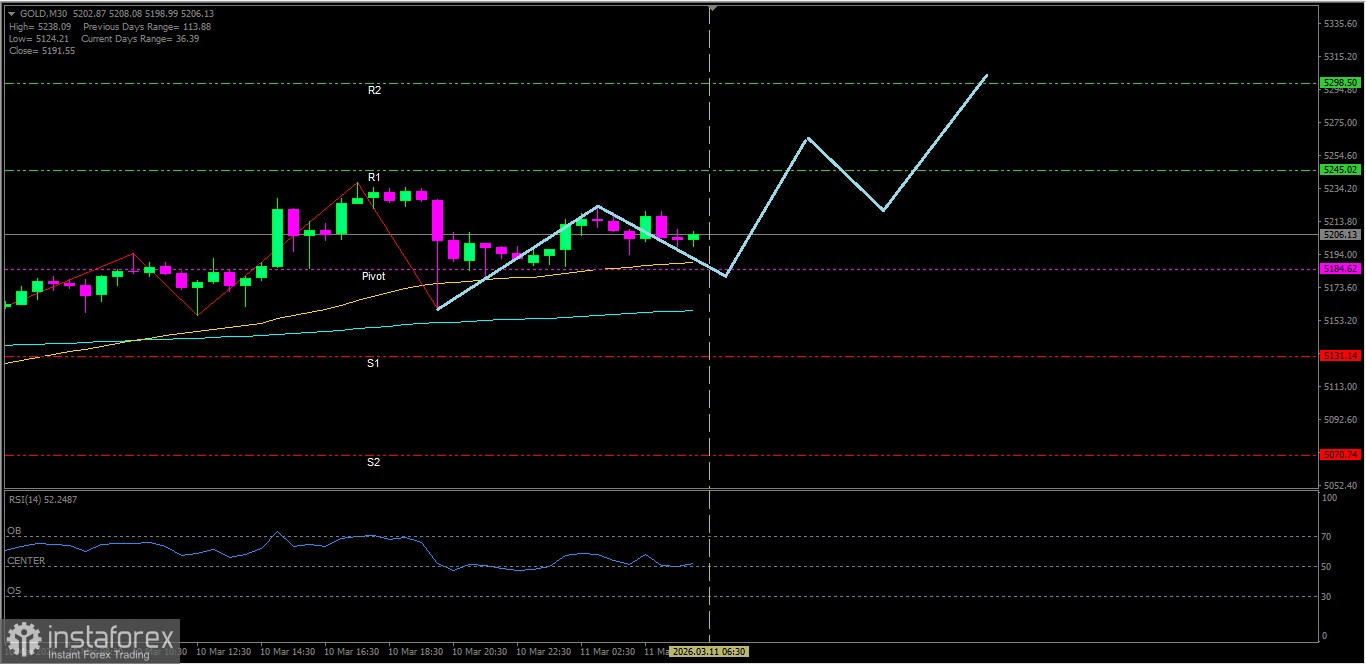
[Gold]
With EMA(50) and EMA(200) condition in a Golden Cross intersection and RSI(14) indicator in the Neutral-Bullish area, then Gold is likely to test its nearest resistance level in the near term.
Key Levels
1. Resistance. 2 : 5298.50
2. Resistance. 1 : 5245.02
3. Pivot : 5184.62
4. Support. 1 : 5131.14
5. Support. 2 : 5070.74
Tactical Scenario
Positive Reaction Zone: If the price holds at 5184.62, Gold is likely to move up toward 5245.02.
Momentum Extension Bias: If 5245.02 is broken, Gold could continue higher to test 5298.50.
Invalidation Level / Bias Revision
The upside bias weakens if Gold falls below 5070.74.
Technical Summary
EMA(50) : 5188.51
EMA(200): 5159.06
RSI(14) : 50.54
Economic News Release Agenda:
Today the United States will release the following economic data:
US - Core CPI m/m - 19:30 WIB
US - CPI m/m - 19:30 WIB
US - CPI y/y - 19:30 WIB
US - Crude Oil Inventories - 21:30 WIB
US - 10-y Bond Auction - 00:01 WIB
US - Federal Budget Balance - 01:00 WIB
*এখানে পোস্ট করা মার্কেট বিশ্লেষণ আপনার সচেতনতা বৃদ্ধির জন্য প্রদান করা হয়, ট্রেড করার নির্দেশনা প্রদানের জন্য প্রদান করা হয় না।
ইন্সটাফরেক্স বিশ্লেষণমূলক পর্যালোচনাগুলো আপনাকে মার্কেট প্রবণতা সম্পর্কে পুরোপুরি সচেতন করবে! ইন্সটাফরেক্সের একজন গ্রাহক হওয়ায়, দক্ষ ট্রেডিং এর জন্য আপনাকে অনেক সেবা বিনামূল্যে প্রদান করা হয়।


