


انسٹا فاریکس ٹیم میں لیجنڈ!
لیجنڈ!آپ کو لگتا ہے کہ یہ حیرت انگیز بیانات ہے؟ لیکن ہمیں ایسے شخص کو کیا کہنا چاہئے ، جو 18 سال میں جونیئر ورلڈ شطرنج چیمپئن شپ جیتنے والا پہلا ایشین بن گیا تھا اور 19 میں پہلا ہندوستانی گرینڈ ماسٹر بنا؟ ورلڈ چیمپیئن ٹائٹل کے لئے یہ مشکل آغاز تھا جو وشونااتھ آنند کے لئے تھا ، وہ شخص جو ہمیشہ کے لئے شطرنج کی تاریخ کا حصہ بن گیا تھا۔ انسٹا فاریکس ٹیم میں اب ایک اور لیجنڈ!


Borussia is one of the most titled football clubs in Germany, which has repeatedly proved to fans: the spirit of competition and leadership will certainly lead to success. Trade in the same way that sports professionals play the game: confidently and actively. Keep a "pass" from Borussia FC and be in the lead with InstaSpot!

The rate of decline in EU retail sales accelerated from -1.8% to -3.0%, which was slightly better than the forecast of -3.1%. But in any case, we are talking about a further decline in consumer activity, which is the engine of economic growth. Moreover, month-on-month sales declined by -0.8%.
A slight discrepancy in expectations led to a lack of proper reaction to the euro in terms of its weakening.
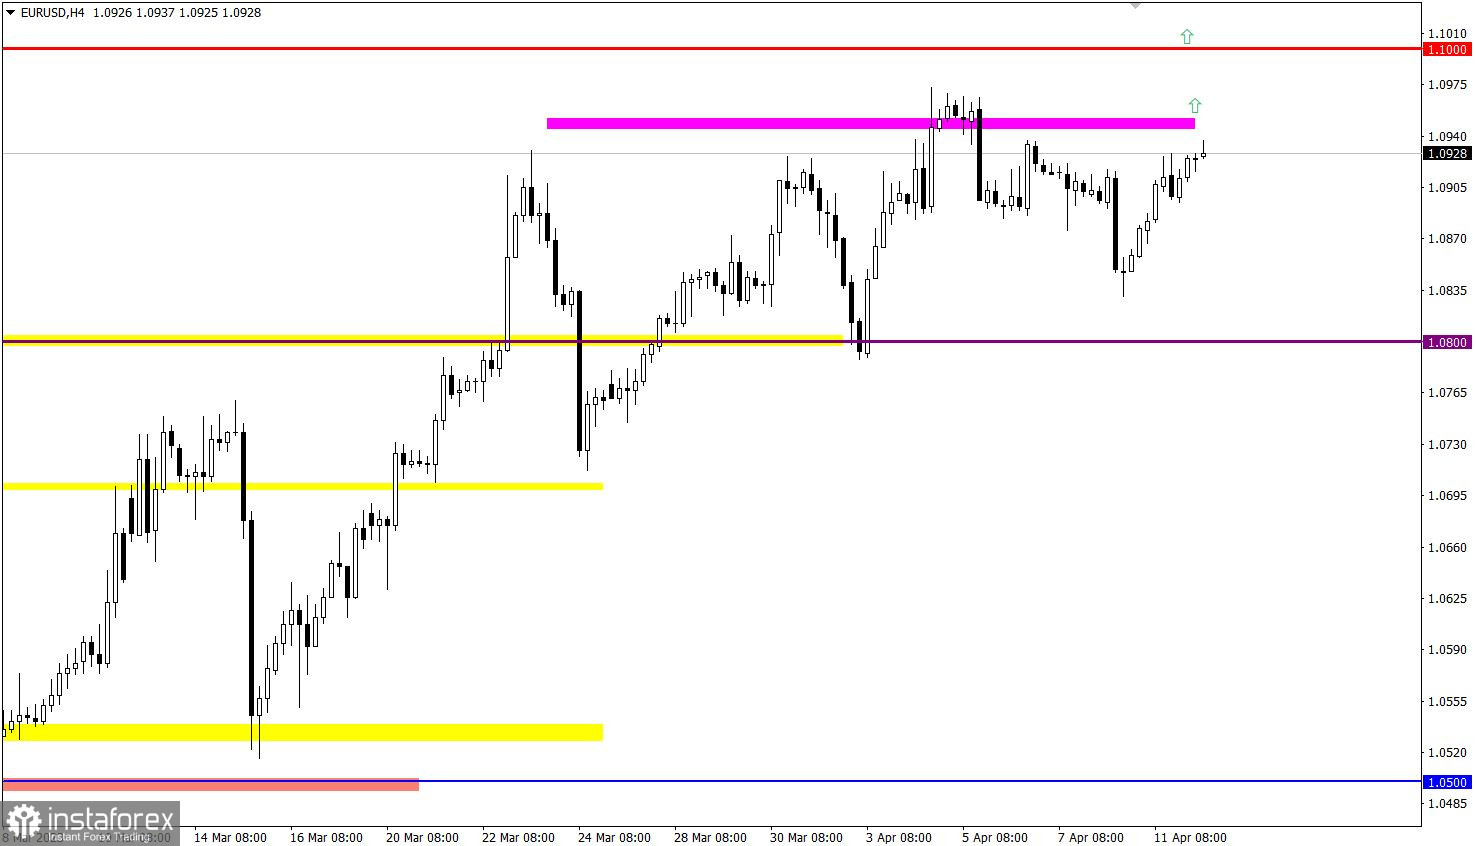
EUR/USD has recovered by more than half since the last pullback, which led to a technical signal of an increase in the volume of long positions.
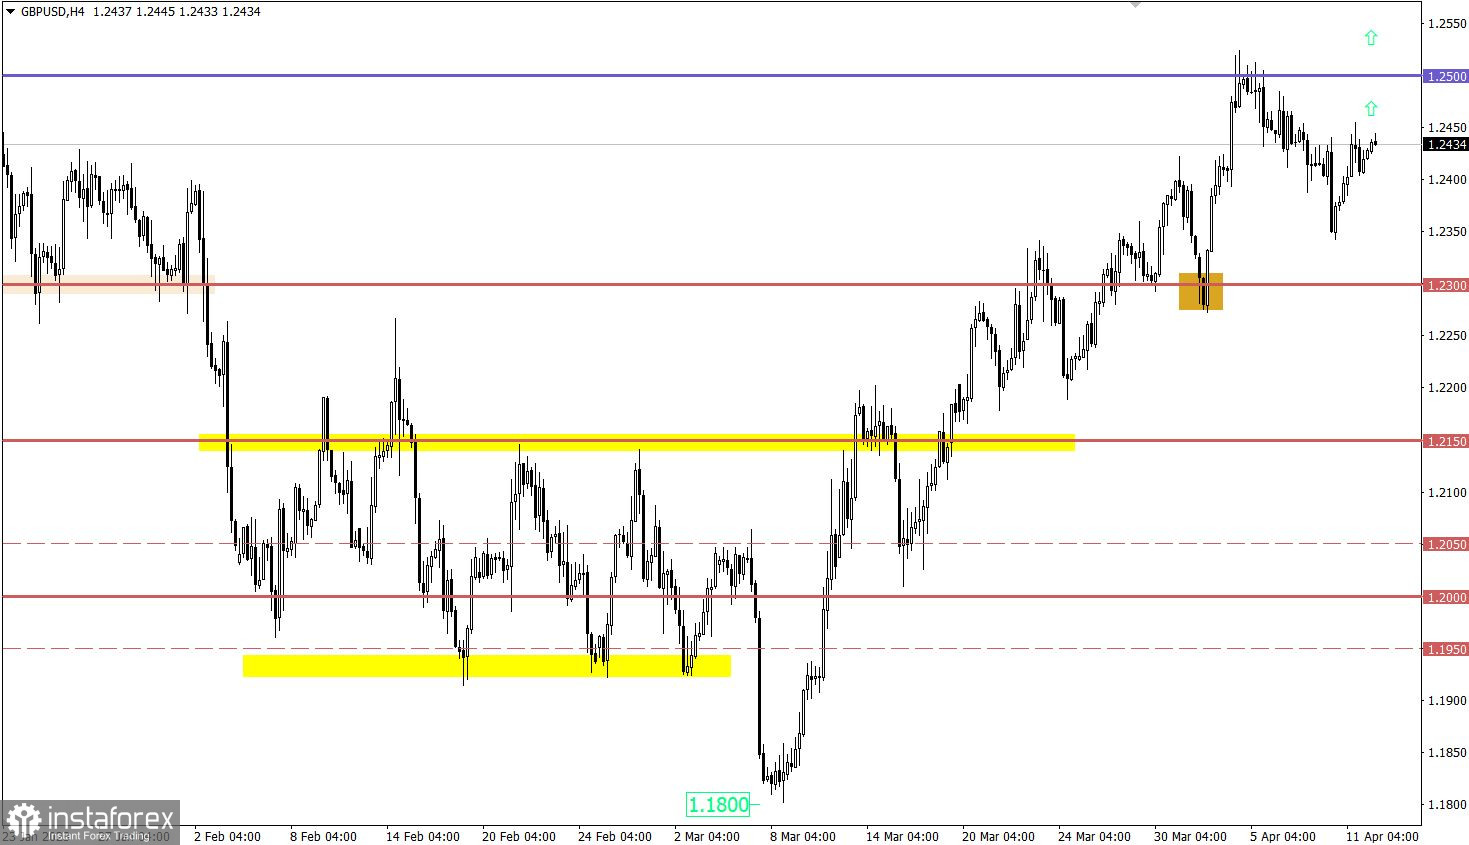
GBP/USD also partially regained its positions relative to the last pullback, indicating the continuation of the upward mood among market participants. In the future, this may lead to an update of the local high of the medium-term trend.

The U.S. inflation data is the main event not just for Wednesday but for the whole week as well, as it could significantly affect the dollar's position. Economists are predicting a slowdown in inflation from 6.0% to 5.8%, which raises the possibility that the Fed will soon move to a softer monetary policy. As a result, the U.S. dollar may weaken against the euro and pound sterling.
Time targeting:
U.S. Inflation – 12:30 UTC
The probability of continuation of the medium-term upward trend increases with a stable price retention above the 1.0950 level, which, in turn, may lead to an update of the weekly high.
It is likely that if the price returns above 1.2450, it will signal the completion of the pullback stage, which, in turn, will lead to an increase in the volume of long positions and an update of the local high of the medium-term trend. However, if the technical signal turns out to be false and the quote returns below 1.2350, it will be regarded by traders as an alternative scenario.
The candlestick chart type is white and black graphic rectangles with lines above and below. With a detailed analysis of each individual candle, you can see its characteristics relative to a particular time frame: opening price, closing price, intraday high and low.
Horizontal levels are price coordinates, relative to which a price may stop or reverse its trajectory. In the market, these levels are called support and resistance.
Circles and rectangles are highlighted examples where the price reversed in history. This color highlighting indicates horizontal lines that may put pressure on the asset's price in the future.
The up/down arrows are landmarks of the possible price direction in the future.
*تعینات کیا مراد ہے مارکیٹ کے تجزیات یہاں ارسال کیے جاتے ہیں جس کا مقصد آپ کی بیداری بڑھانا ہے، لیکن تجارت کرنے کے لئے ہدایات دینا نہیں.
InstaSpot analytical reviews will make you fully aware of market trends! Being an InstaSpot client, you are provided with a large number of free services for efficient trading.


