


Il y a maintenant plus de 7 millions de traders dans notre équipe! Chaque jour nous travaillons à améliorer le trading. On s'efforce de vous offrir le meilleur et on obtient les plus beaux succès.
La confiance de millions de traders partout dans le monde est l'évaluation la plus élevée de notre travail!
Vous avez fait votre choix et nous allons faire de notre mieux pour répondre à vos attentes!
Ensemble, nous faisons une super équipe!
InstaSpot est fier de vous servir!


L'acteur, le champion de l'UFC et un vrai bogatyr russe! . Homme qui ne doit sa réussite qu'à lui-même. L'homme qui est sur la même route que nous suivons.
Le secret du succès de Taktarov est le progrès permanent vers la réalisation de son objectif.
Découvrez toutes les facettes de votre talent! Apprenez, essayez, commettez des erreurs, mais ne vous arrêtez pas!
InstaSpot - L'histoire de votre succès commence ici !
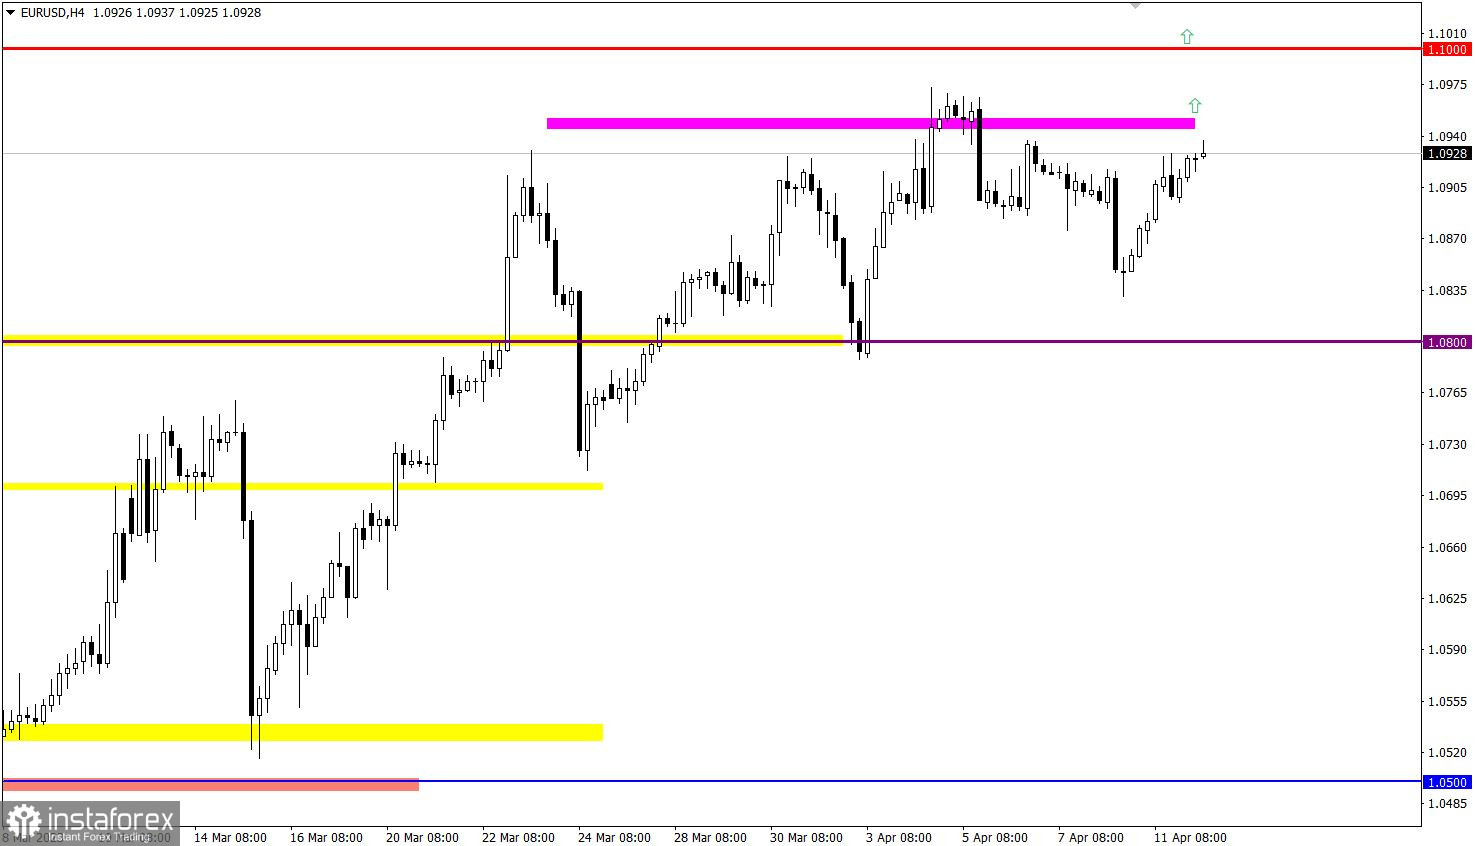
The rate of decline in EU retail sales accelerated from -1.8% to -3.0%, which was slightly better than the forecast of -3.1%. But in any case, we are talking about a further decline in consumer activity, which is the engine of economic growth. Moreover, month-on-month sales declined by -0.8%.
A slight discrepancy in expectations led to a lack of proper reaction to the euro in terms of its weakening.
EUR/USD has recovered by more than half since the last pullback, which led to a technical signal of an increase in the volume of long positions.
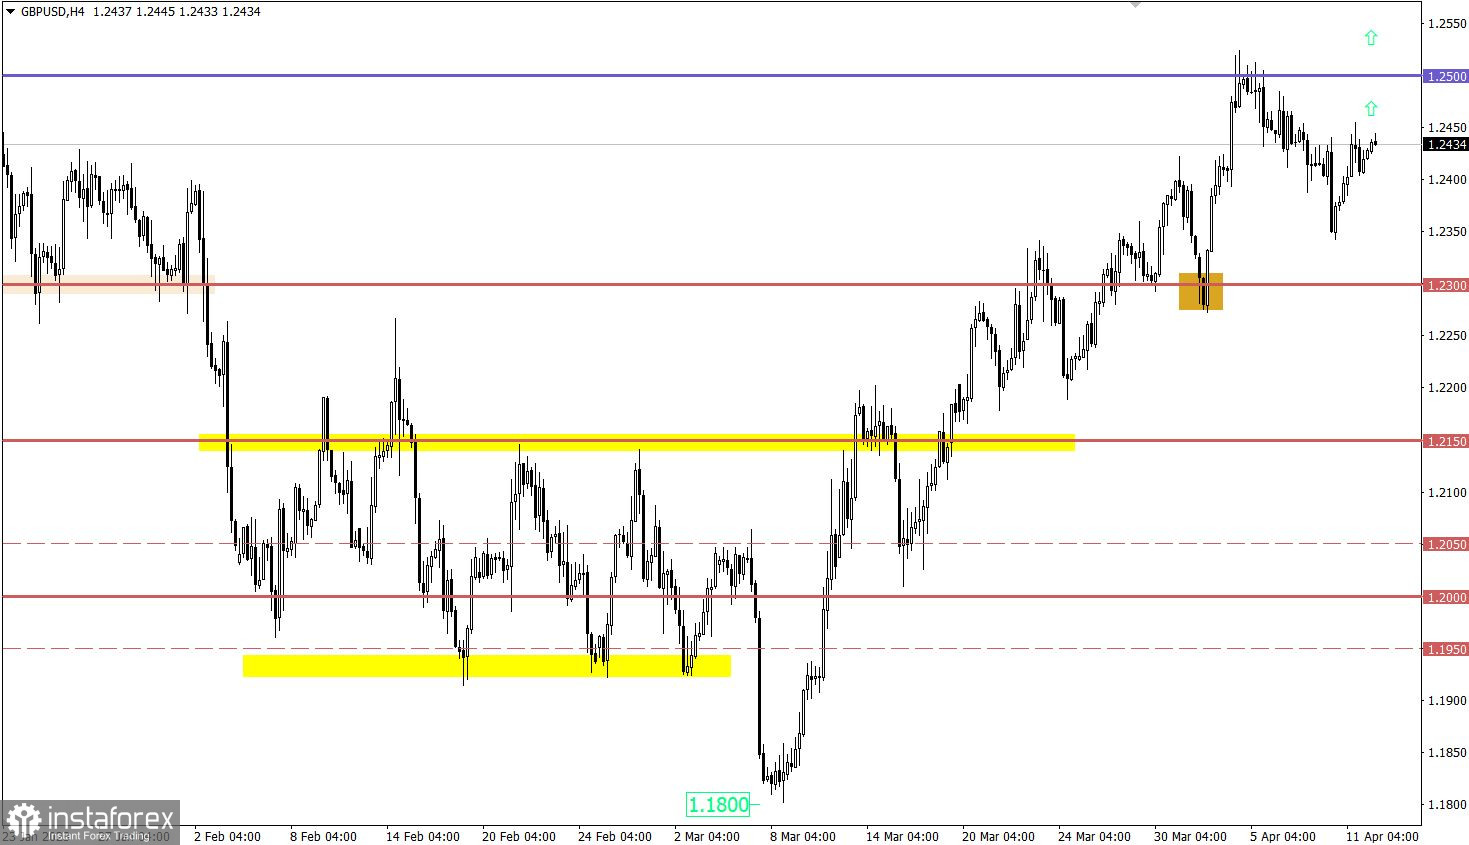
GBP/USD also partially regained its positions relative to the last pullback, indicating the continuation of the upward mood among market participants. In the future, this may lead to an update of the local high of the medium-term trend.

The U.S. inflation data is the main event not just for Wednesday but for the whole week as well, as it could significantly affect the dollar's position. Economists are predicting a slowdown in inflation from 6.0% to 5.8%, which raises the possibility that the Fed will soon move to a softer monetary policy. As a result, the U.S. dollar may weaken against the euro and pound sterling.
Time targeting:
U.S. Inflation – 12:30 UTC
The probability of continuation of the medium-term upward trend increases with a stable price retention above the 1.0950 level, which, in turn, may lead to an update of the weekly high.
It is likely that if the price returns above 1.2450, it will signal the completion of the pullback stage, which, in turn, will lead to an increase in the volume of long positions and an update of the local high of the medium-term trend. However, if the technical signal turns out to be false and the quote returns below 1.2350, it will be regarded by traders as an alternative scenario.
The candlestick chart type is white and black graphic rectangles with lines above and below. With a detailed analysis of each individual candle, you can see its characteristics relative to a particular time frame: opening price, closing price, intraday high and low.
Horizontal levels are price coordinates, relative to which a price may stop or reverse its trajectory. In the market, these levels are called support and resistance.
Circles and rectangles are highlighted examples where the price reversed in history. This color highlighting indicates horizontal lines that may put pressure on the asset's price in the future.
The up/down arrows are landmarks of the possible price direction in the future.
*The market analysis posted here is meant to increase your awareness, but not to give instructions to make a trade.
InstaSpot analytical reviews will make you fully aware of market trends! Being an InstaSpot client, you are provided with a large number of free services for efficient trading.


