


我们的团队有超过700万的操盘手!
我们每天都在一起努力改善交易。我们得到了很高的成绩,并继续前进。
世界各地数以百万计的操盘手的认可是我们工作的最大赞赏! 您做出了您的选择,我们将尽一切努力来满足您的期望!
我们是一个共同的伟大团队!
InstaSpot. 自豪地为您工作!


The rate of decline in EU retail sales accelerated from -1.8% to -3.0%, which was slightly better than the forecast of -3.1%. But in any case, we are talking about a further decline in consumer activity, which is the engine of economic growth. Moreover, month-on-month sales declined by -0.8%.
A slight discrepancy in expectations led to a lack of proper reaction to the euro in terms of its weakening.
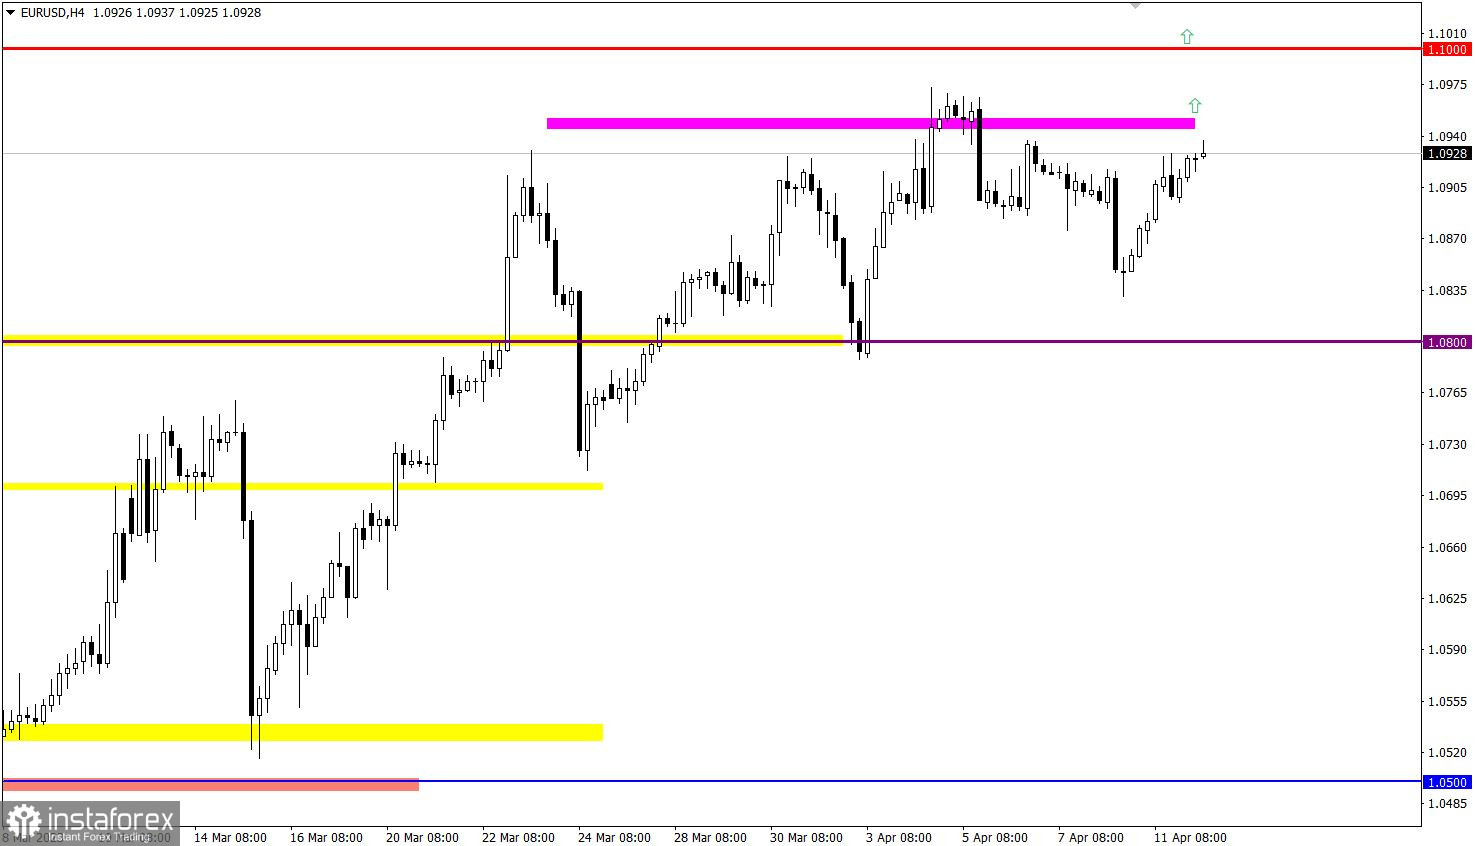
EUR/USD has recovered by more than half since the last pullback, which led to a technical signal of an increase in the volume of long positions.
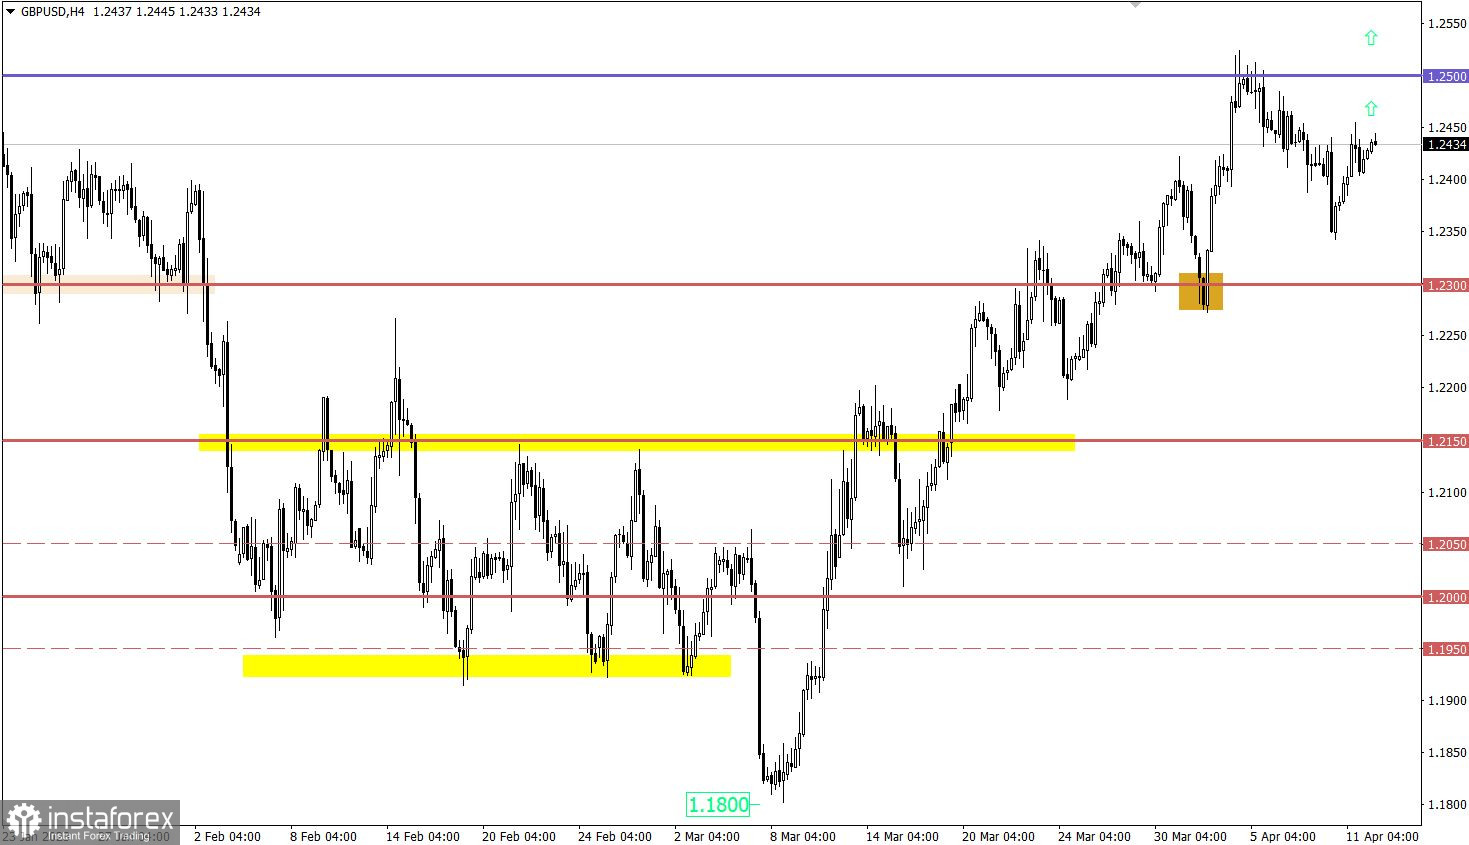
GBP/USD also partially regained its positions relative to the last pullback, indicating the continuation of the upward mood among market participants. In the future, this may lead to an update of the local high of the medium-term trend.

The U.S. inflation data is the main event not just for Wednesday but for the whole week as well, as it could significantly affect the dollar's position. Economists are predicting a slowdown in inflation from 6.0% to 5.8%, which raises the possibility that the Fed will soon move to a softer monetary policy. As a result, the U.S. dollar may weaken against the euro and pound sterling.
Time targeting:
U.S. Inflation – 12:30 UTC
The probability of continuation of the medium-term upward trend increases with a stable price retention above the 1.0950 level, which, in turn, may lead to an update of the weekly high.
It is likely that if the price returns above 1.2450, it will signal the completion of the pullback stage, which, in turn, will lead to an increase in the volume of long positions and an update of the local high of the medium-term trend. However, if the technical signal turns out to be false and the quote returns below 1.2350, it will be regarded by traders as an alternative scenario.
The candlestick chart type is white and black graphic rectangles with lines above and below. With a detailed analysis of each individual candle, you can see its characteristics relative to a particular time frame: opening price, closing price, intraday high and low.
Horizontal levels are price coordinates, relative to which a price may stop or reverse its trajectory. In the market, these levels are called support and resistance.
Circles and rectangles are highlighted examples where the price reversed in history. This color highlighting indicates horizontal lines that may put pressure on the asset's price in the future.
The up/down arrows are landmarks of the possible price direction in the future.
*这里的市场分析是为了增加您对市场的了解,而不是给出交易的指示。
InstaSpot分析评论将让您充分了解市场趋势! 作为InstaSpot的客户,您将获得大量的免费服务以实现有效的交易。


