


Nella nostra squadra ci sono più di 7.000.000 trader! Ogni giorno ci impegniamo a far sì che il trading migliori. Conseguiamo grandi risultati e ci muoviamo in avanti.
Il riconoscimento da parte di milioni di trader in tutto il mondo rappresenta l'alta valutazione della nostra attività! Voi avete fatto la vostra scelta e noi faremo la nostra al fine di soddisfare le vostre aspettative!
Assieme siamo una grande squadra!
InstaSpot. Siamo orgogliosi di lavorare per voi!


Attore, campione del mondo di lotta libera e semplicemente un vero maciste russo! Persona venuta dal nulla. Persona che rispecchia i nostri obiettivi. Il segreto del successo di Taktarov consiste nel mirare continuamente al suo scopo.
Dischiudi anche tu tutti gli aspetti del tuo talento! Impara, prova, sbaglia, ma non fermarti!
InstaSpot - la storia delle tue vittorie inizia qui!

The rate of decline in EU retail sales accelerated from -1.8% to -3.0%, which was slightly better than the forecast of -3.1%. But in any case, we are talking about a further decline in consumer activity, which is the engine of economic growth. Moreover, month-on-month sales declined by -0.8%.
A slight discrepancy in expectations led to a lack of proper reaction to the euro in terms of its weakening.
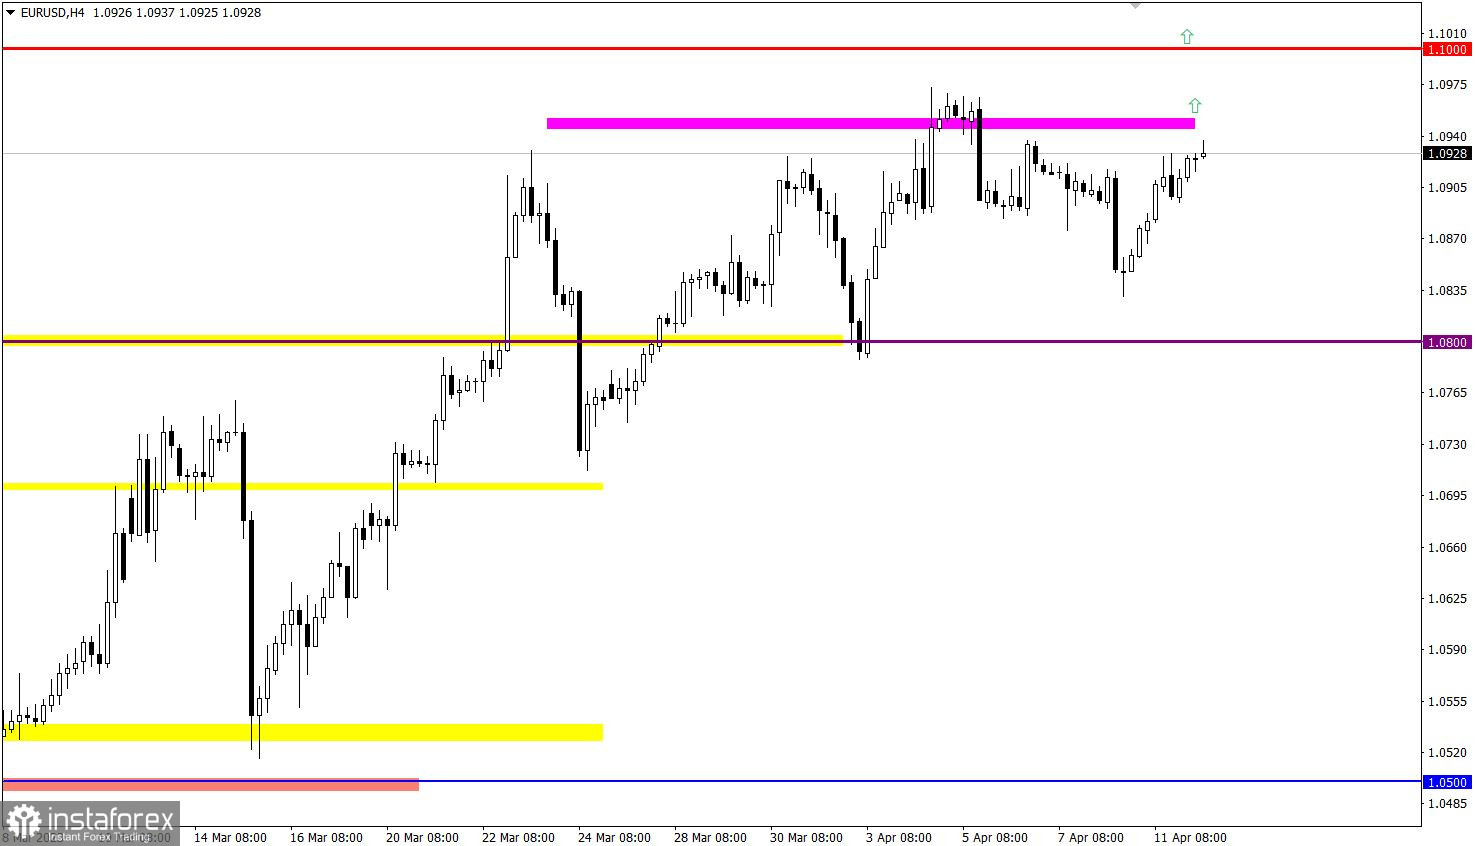
EUR/USD has recovered by more than half since the last pullback, which led to a technical signal of an increase in the volume of long positions.
GBP/USD also partially regained its positions relative to the last pullback, indicating the continuation of the upward mood among market participants. In the future, this may lead to an update of the local high of the medium-term trend.

The U.S. inflation data is the main event not just for Wednesday but for the whole week as well, as it could significantly affect the dollar's position. Economists are predicting a slowdown in inflation from 6.0% to 5.8%, which raises the possibility that the Fed will soon move to a softer monetary policy. As a result, the U.S. dollar may weaken against the euro and pound sterling.
Time targeting:
U.S. Inflation – 12:30 UTC
The probability of continuation of the medium-term upward trend increases with a stable price retention above the 1.0950 level, which, in turn, may lead to an update of the weekly high.
It is likely that if the price returns above 1.2450, it will signal the completion of the pullback stage, which, in turn, will lead to an increase in the volume of long positions and an update of the local high of the medium-term trend. However, if the technical signal turns out to be false and the quote returns below 1.2350, it will be regarded by traders as an alternative scenario.
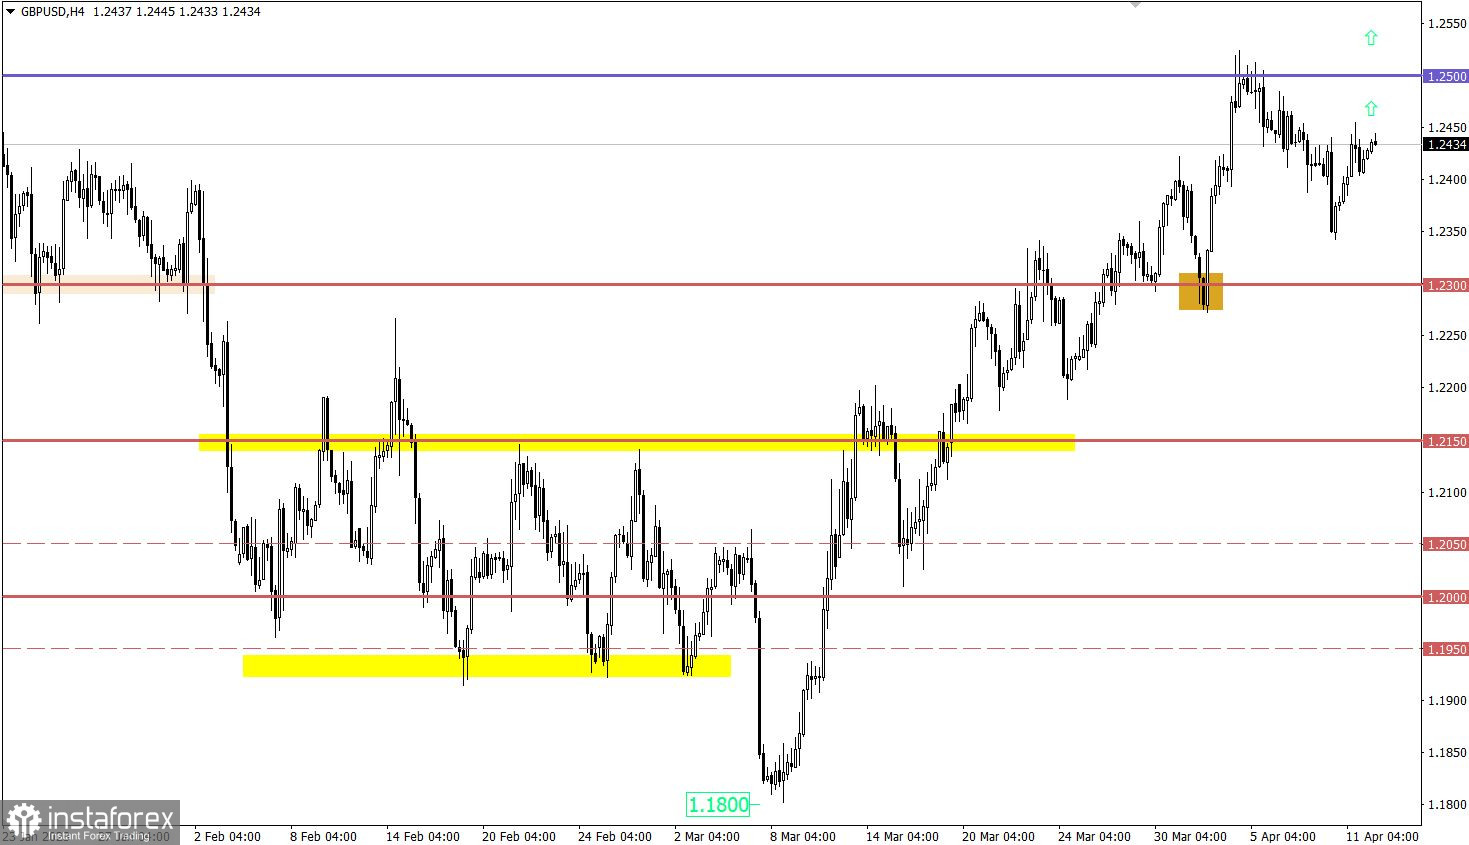
The candlestick chart type is white and black graphic rectangles with lines above and below. With a detailed analysis of each individual candle, you can see its characteristics relative to a particular time frame: opening price, closing price, intraday high and low.
Horizontal levels are price coordinates, relative to which a price may stop or reverse its trajectory. In the market, these levels are called support and resistance.
Circles and rectangles are highlighted examples where the price reversed in history. This color highlighting indicates horizontal lines that may put pressure on the asset's price in the future.
The up/down arrows are landmarks of the possible price direction in the future.
*La presente analisi del mercato ha un carattere esclusivamente informativo e non rappresenta una guida per l`effettuazione di una transazione.
Le recensioni analitiche di InstaSpot ti renderanno pienamente consapevole delle tendenze del mercato! Essendo un cliente InstaSpot, ti viene fornito un gran numero di servizi gratuiti per il trading efficiente.


