


La leggenda nel team InstaSpot!!
Legenda! Pensi che sia troppo patetico? Ma come dobbiamo chiamare un uomo, che è diventato il primo dell'Asia a vincere il campionato mondiale di scacchi a 18 anni e che è diventato il primo Gran Maestro indiano a 19? Fu l'inizio di un duro cammino verso il titolo di campione del mondo, l'uomo che divenne per sempre una parte della storia di scacchi. Un'altra leggenda nel team InstaSpot!


Il Borussia è una delle squadre di calcio più titolate in Germania, che ha ripetutamente dimostrato ai tifosi che lo spirito di competizione e leadership porta al successo. Fai trading nello stesso modo in cui lo fanno i professionisti dello sport - fiduciosamente e attivamente. Segui il Borussia FC e sii avanti con InstaSpot!

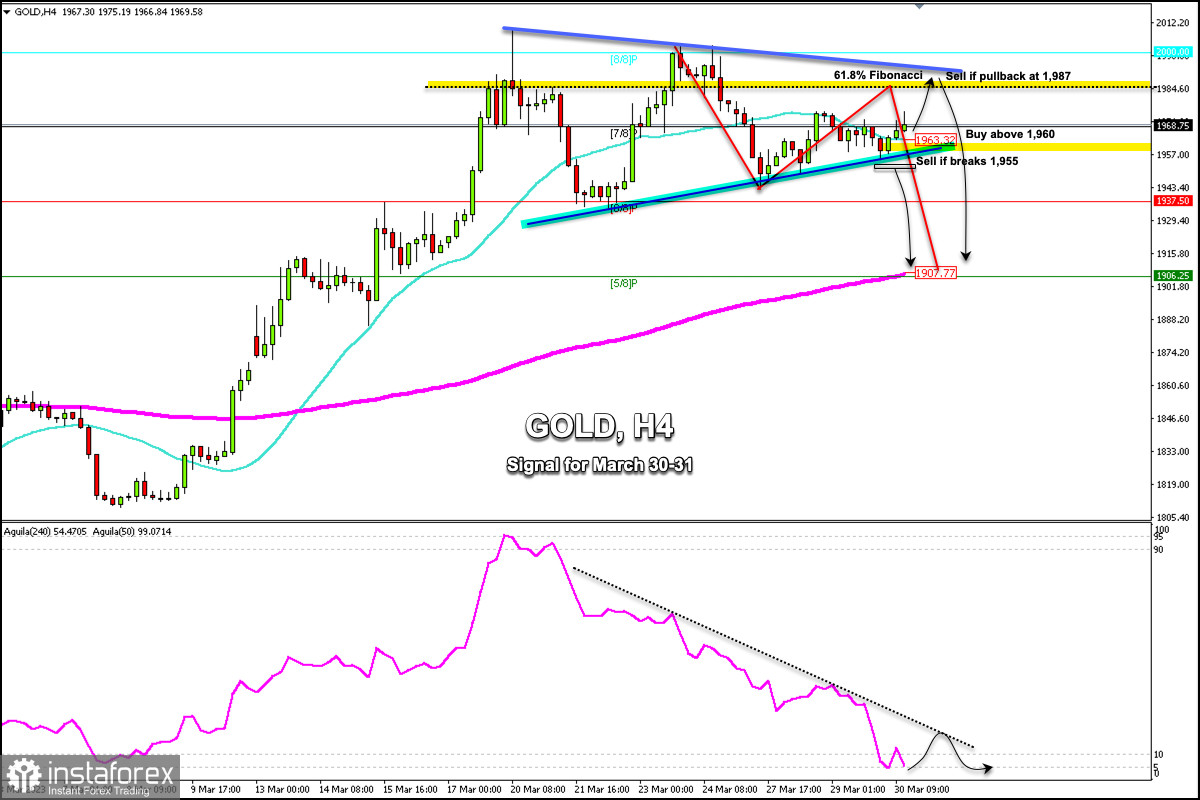
Early in the American session, Gold (XAU/USD) is trading around 1,968 above 7/8 Murray and above the 21 SMA located at 1,963.32.
According to the 4-hour chart, we can see that gold is making a technical rebound after falling from the high of 2,003.21 to the low of 1,943.86.
This movement could mean a correction towards the 61.8% Fibonacci, located around 1,984. A pullback towards this area could be a sign for gold to resume its bearish cycle and it could reach the 200 EMA located at 1,907 in the next few days.
XAU/USD is currently trading above the 21 SMA located at 1,963 which favors a bullish movement. If it consolidates above this level, it could continue to rise until it reaches 1,975 and 1,987.
A pullback to the resistance zone of the downtrend channel formed between the high of 2009 and 2003 could be a point to sell around 1,987, with targets at 1,950 and 1,907 (200 EMA).
For gold to resume its bullish cycle, we should expect a sharp break above 1,990 and consolidation above 8/8 Murray (2000). Then, the metal could reach +1/8 Murray located at 2,031.25.
Conversely, for gold to turn more bearish, it will need to break the bottom of the uptrend channel formed between the low of 1,934 and 1,943. Then, it could reach 1,937 (6/8 Murray) and 1,907 (200 EMA).
The Eagle indicator has reached the extremely oversold zone around 5 points which is likely to be followed by any technical bounce. As long as it does not break its pressure line, it could be a signal to sell.
*La presente analisi del mercato ha un carattere esclusivamente informativo e non rappresenta una guida per l`effettuazione di una transazione.
Le recensioni analitiche di InstaSpot ti renderanno pienamente consapevole delle tendenze del mercato! Essendo un cliente InstaSpot, ti viene fornito un gran numero di servizi gratuiti per il trading efficiente.


