


فريقنا لديه أكثر من 7,000,000 من التجار!
كل يوم نعمل معا لتحسين التداول. نحصل على نتائج عالية ونمضي قدما.
الاعتراف من قبل الملايين من التجار في جميع أنحاء العالم هو أفضل تقدير لعملنا! لقد قمت باختيارك وسنفعل كل ما يلزم لتلبية توقعاتك!
نحن فريق رائع معا!
إنستافوركس تعتز بالعمل بالنسبة لك!


الممثل وبطل مسابقة يو إف سي 6 وبطل حقيقي!
الرجل الذي حقق النجاح بعمله الدؤوب. الرجل الذي يذهب كما نريد.
سر نجاح تاكتاروف هو حركة مستمرة نحو الهدف.
اكشف عن جميع جوانب موهبتك!
اكتشف، وحاول، وافشل - ولكن لا تتوقف أبدا!
إنستافوركس. تبدأ قصة نجاحك من هنا!
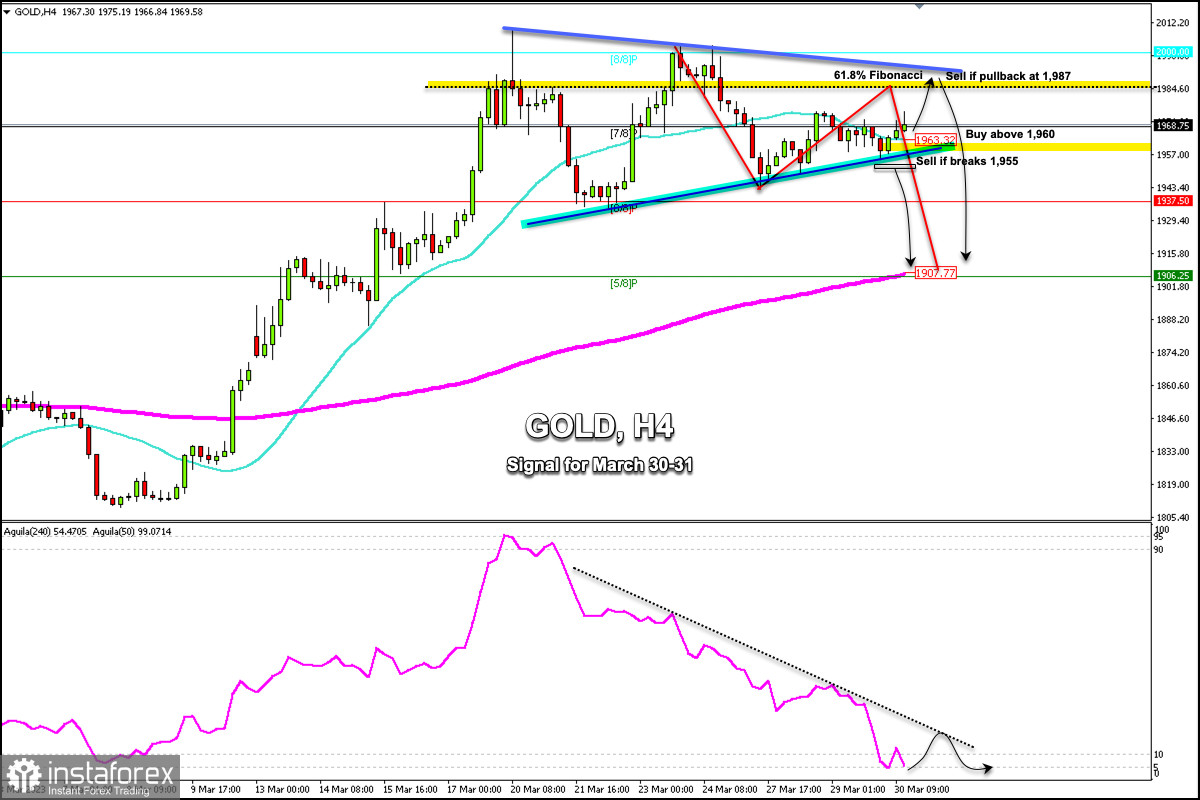
Early in the American session, Gold (XAU/USD) is trading around 1,968 above 7/8 Murray and above the 21 SMA located at 1,963.32.
According to the 4-hour chart, we can see that gold is making a technical rebound after falling from the high of 2,003.21 to the low of 1,943.86.
This movement could mean a correction towards the 61.8% Fibonacci, located around 1,984. A pullback towards this area could be a sign for gold to resume its bearish cycle and it could reach the 200 EMA located at 1,907 in the next few days.
XAU/USD is currently trading above the 21 SMA located at 1,963 which favors a bullish movement. If it consolidates above this level, it could continue to rise until it reaches 1,975 and 1,987.
A pullback to the resistance zone of the downtrend channel formed between the high of 2009 and 2003 could be a point to sell around 1,987, with targets at 1,950 and 1,907 (200 EMA).
For gold to resume its bullish cycle, we should expect a sharp break above 1,990 and consolidation above 8/8 Murray (2000). Then, the metal could reach +1/8 Murray located at 2,031.25.
Conversely, for gold to turn more bearish, it will need to break the bottom of the uptrend channel formed between the low of 1,934 and 1,943. Then, it could reach 1,937 (6/8 Murray) and 1,907 (200 EMA).
The Eagle indicator has reached the extremely oversold zone around 5 points which is likely to be followed by any technical bounce. As long as it does not break its pressure line, it could be a signal to sell.
*The market analysis posted here is meant to increase your awareness, but not to give instructions to make a trade.
InstaSpot analytical reviews will make you fully aware of market trends! Being an InstaSpot client, you are provided with a large number of free services for efficient trading.


