


The legend in the InstaSpot team!
Legend! You think that's bombastic rhetoric? But how should we call a man, who became the first Asian to win the junior world chess championship at 18 and who became the first Indian Grandmaster at 19? That was the start of a hard path to the World Champion title for Viswanathan Anand, the man who became a part of history of chess forever. Now one more legend in the InstaSpot team!


Borussia is one of the most titled football clubs in Germany, which has repeatedly proved to fans: the spirit of competition and leadership will certainly lead to success. Trade in the same way that sports professionals play the game: confidently and actively. Keep a "pass" from Borussia FC and be in the lead with InstaSpot!
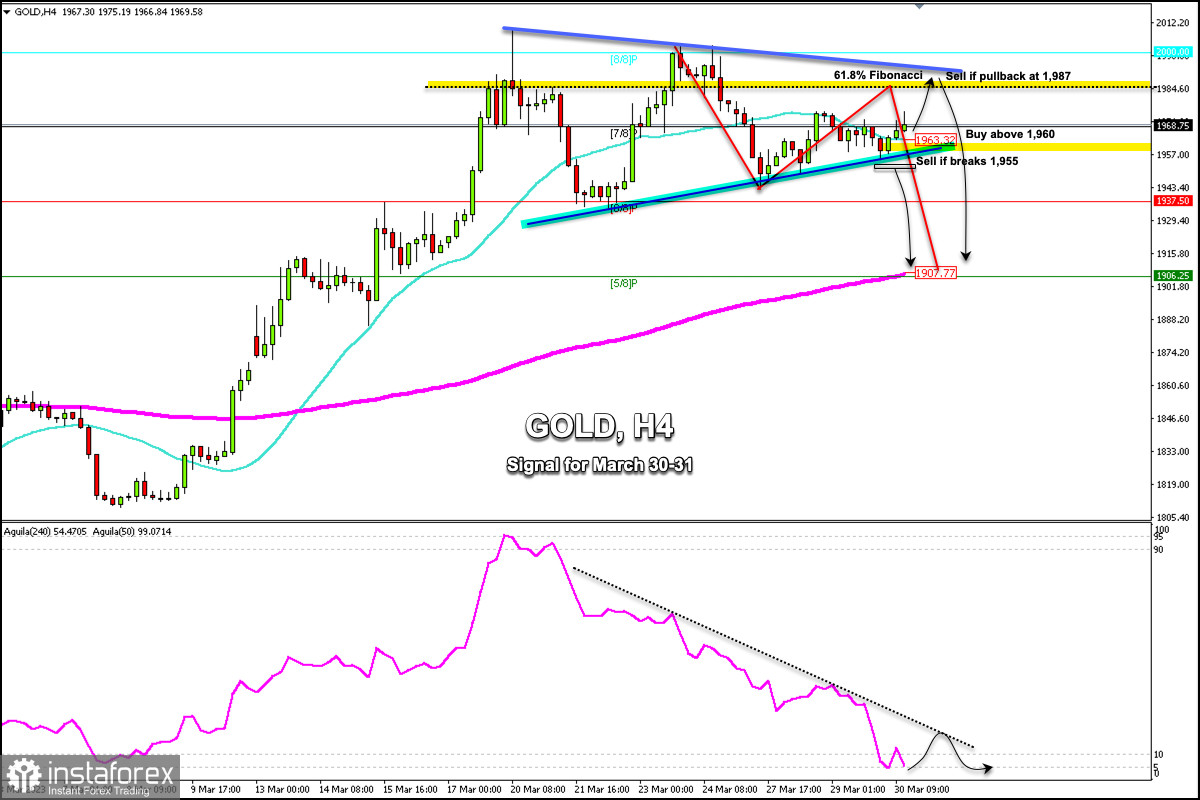
Early in the American session, Gold (XAU/USD) is trading around 1,968 above 7/8 Murray and above the 21 SMA located at 1,963.32.
According to the 4-hour chart, we can see that gold is making a technical rebound after falling from the high of 2,003.21 to the low of 1,943.86.
This movement could mean a correction towards the 61.8% Fibonacci, located around 1,984. A pullback towards this area could be a sign for gold to resume its bearish cycle and it could reach the 200 EMA located at 1,907 in the next few days.
XAU/USD is currently trading above the 21 SMA located at 1,963 which favors a bullish movement. If it consolidates above this level, it could continue to rise until it reaches 1,975 and 1,987.
A pullback to the resistance zone of the downtrend channel formed between the high of 2009 and 2003 could be a point to sell around 1,987, with targets at 1,950 and 1,907 (200 EMA).
For gold to resume its bullish cycle, we should expect a sharp break above 1,990 and consolidation above 8/8 Murray (2000). Then, the metal could reach +1/8 Murray located at 2,031.25.
Conversely, for gold to turn more bearish, it will need to break the bottom of the uptrend channel formed between the low of 1,934 and 1,943. Then, it could reach 1,937 (6/8 Murray) and 1,907 (200 EMA).
The Eagle indicator has reached the extremely oversold zone around 5 points which is likely to be followed by any technical bounce. As long as it does not break its pressure line, it could be a signal to sell.
*这里的市场分析是为了增加您对市场的了解,而不是给出交易的指示。
InstaSpot分析评论将让您充分了解市场趋势! 作为InstaSpot的客户,您将获得大量的免费服务以实现有效的交易。


