


Legenda tim InstaSpot!
Legenda! Anda pikir legenda adalah retorika yang bombastis? Lalu, bagaimana menyebut seorang pria, seorang Asia pertama yang memenangkan kejuaraan catur dunia junior pada usia 18 tahun, dan yang menjadi Grandmaster India pertama pada usia 19 tahun? Itulah awal perjalanan yang sulit dalam meraih gelar Juara Dunia bagi Viswanathan Anand, pria yang menjadi bagian dari sejarah catur untuk selamanya. Sekarang, satu lagi legenda masuk ke dalam tim InstaSpot!


Borussia merupakan salah satu klub sepakbola paling terkenal di Jerman, yang telah berulang kali membuktikan pada para penggemarnya: semangat kompetisi dan kepemimpinan pasti akan mengarah pada kesuksesan. Lakukan trading dengan cara yang sama seperti para profesional olahraga: percaya diri dan aktif. Gunakan "kunci" dari Borussia FC dan jadilah yang terdepan bersama InstaSpot!

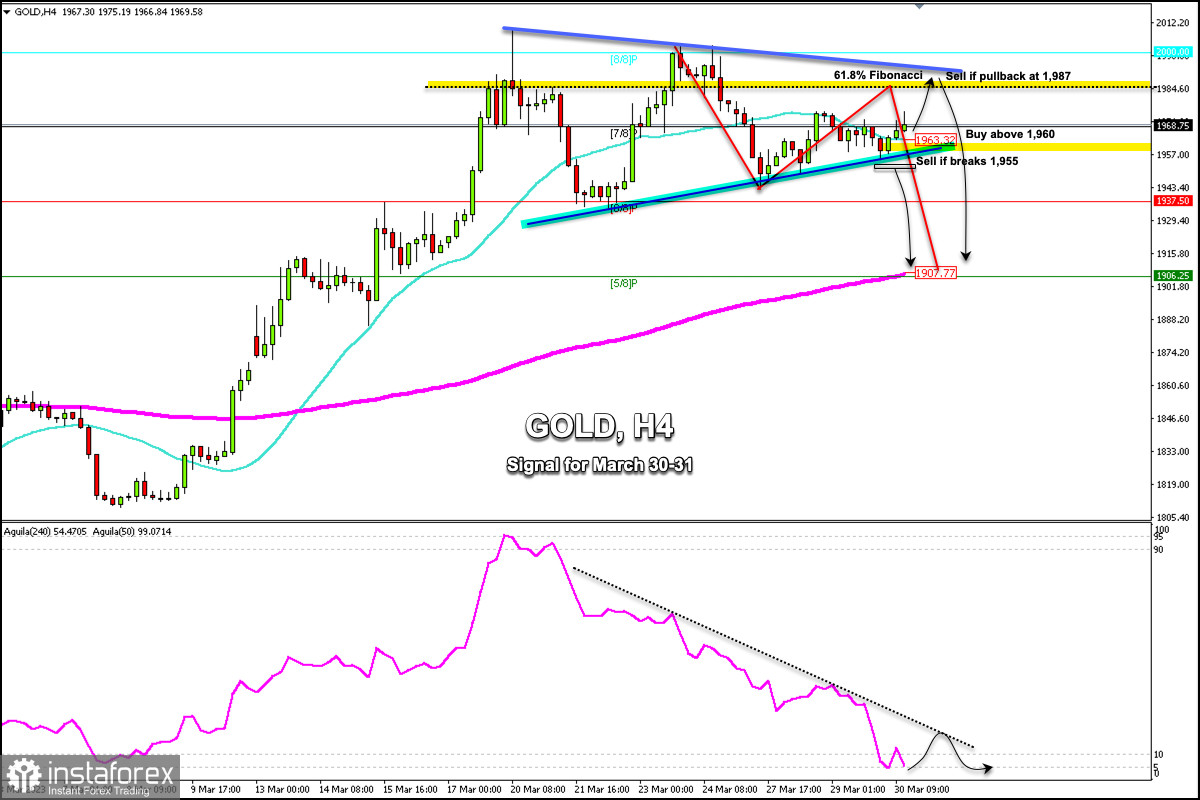
Early in the American session, Gold (XAU/USD) is trading around 1,968 above 7/8 Murray and above the 21 SMA located at 1,963.32.
According to the 4-hour chart, we can see that gold is making a technical rebound after falling from the high of 2,003.21 to the low of 1,943.86.
This movement could mean a correction towards the 61.8% Fibonacci, located around 1,984. A pullback towards this area could be a sign for gold to resume its bearish cycle and it could reach the 200 EMA located at 1,907 in the next few days.
XAU/USD is currently trading above the 21 SMA located at 1,963 which favors a bullish movement. If it consolidates above this level, it could continue to rise until it reaches 1,975 and 1,987.
A pullback to the resistance zone of the downtrend channel formed between the high of 2009 and 2003 could be a point to sell around 1,987, with targets at 1,950 and 1,907 (200 EMA).
For gold to resume its bullish cycle, we should expect a sharp break above 1,990 and consolidation above 8/8 Murray (2000). Then, the metal could reach +1/8 Murray located at 2,031.25.
Conversely, for gold to turn more bearish, it will need to break the bottom of the uptrend channel formed between the low of 1,934 and 1,943. Then, it could reach 1,937 (6/8 Murray) and 1,907 (200 EMA).
The Eagle indicator has reached the extremely oversold zone around 5 points which is likely to be followed by any technical bounce. As long as it does not break its pressure line, it could be a signal to sell.
*Analisis pasar yang diposting disini dimaksudkan untuk meningkatkan pengetahuan Anda namun tidak untuk memberi instruksi trading.
Tinjauan analitis InstaSpot akan membuat Anda menyadari sepenuhnya tren pasar! Sebagai klien InstaSpot, Anda dilengkapi dengan sejumlah besar layanan gratis untuk trading yang efisien.


