


La leggenda nel team InstaSpot!!
Legenda! Pensi che sia troppo patetico? Ma come dobbiamo chiamare un uomo, che è diventato il primo dell'Asia a vincere il campionato mondiale di scacchi a 18 anni e che è diventato il primo Gran Maestro indiano a 19? Fu l'inizio di un duro cammino verso il titolo di campione del mondo, l'uomo che divenne per sempre una parte della storia di scacchi. Un'altra leggenda nel team InstaSpot!


Il Borussia è una delle squadre di calcio più titolate in Germania, che ha ripetutamente dimostrato ai tifosi che lo spirito di competizione e leadership porta al successo. Fai trading nello stesso modo in cui lo fanno i professionisti dello sport - fiduciosamente e attivamente. Segui il Borussia FC e sii avanti con InstaSpot!

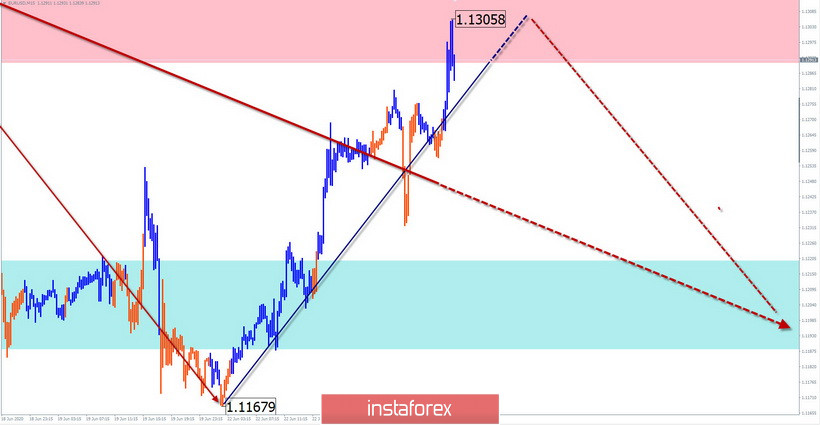
EUR/USD
Analysis:
The last incomplete wave structure of the European currency started on March 20. Since the beginning of May, the final part of the wave (C) has been developing. Within its framework, a flat correction has been formed in the last 3 weeks, which has not been completed yet.
Forecast:
Today, there is a high probability of price movement in the lateral plane between the nearest zones. In the European session, you can wait for the end of the rise. At the end of the day, the exchange rate is expected to change and the price will go down.
Potential reversal zones
Resistance:
- 1.1290/1.13280
Support:
- 1.1220/1.1190
Recommendations:
Trading the euro in the market today is possible within the intra-session style. Priority for the tool is sales.
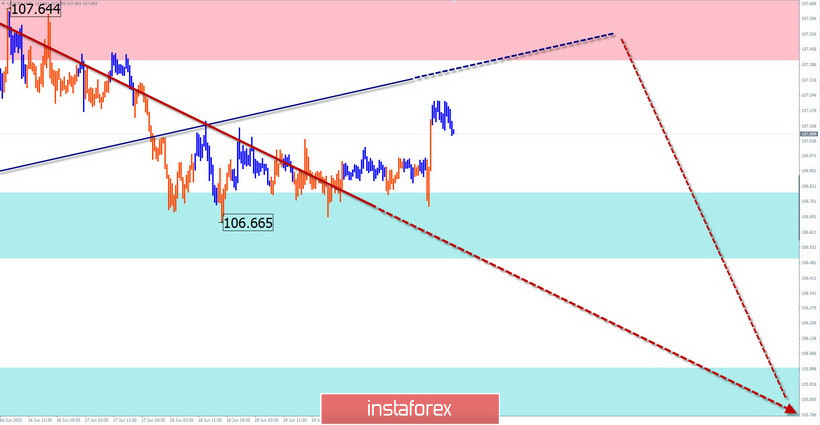
USD/JPY
Analysis:
The direction of the price movement of the Japanese yen since March 20 is set by the bearish wave algorithm. In the last 3 weeks, the price forms the final part of the design. Since last week, the price in the flat forms an intermediate correction.
Forecast:
In the first half of the day today, the end of the bullish section of movement that began yesterday is possible. By the end of the day, you can expect a change in the exchange rate and the price going down. If the nearest support breaks through, the next zone will become the target zone.
Potential reversal zones
Resistance:
- 107.40/107.70
Support:
- 106.80/106.50
- 106.00/105.70
Recommendations:
Purchases of the yen today can be very risky. The best tactic is to wait for the end of the rise and enter short positions on the instrument after the formation of reversal signals.
Explanation: In the simplified wave analysis (UVA), waves consist of 3 parts (A-B-C). The last incomplete wave is analyzed. The solid background of arrows shows the formed structure, and the dotted ones show the expected movements.
Note: The wave algorithm does not take into account the duration of the tool movements in time!
*La presente analisi del mercato ha un carattere esclusivamente informativo e non rappresenta una guida per l`effettuazione di una transazione.
Le recensioni analitiche di InstaSpot ti renderanno pienamente consapevole delle tendenze del mercato! Essendo un cliente InstaSpot, ti viene fornito un gran numero di servizi gratuiti per il trading efficiente.


