


Il y a maintenant plus de 7 millions de traders dans notre équipe! Chaque jour nous travaillons à améliorer le trading. On s'efforce de vous offrir le meilleur et on obtient les plus beaux succès.
La confiance de millions de traders partout dans le monde est l'évaluation la plus élevée de notre travail!
Vous avez fait votre choix et nous allons faire de notre mieux pour répondre à vos attentes!
Ensemble, nous faisons une super équipe!
InstaSpot est fier de vous servir!


L'acteur, le champion de l'UFC et un vrai bogatyr russe! . Homme qui ne doit sa réussite qu'à lui-même. L'homme qui est sur la même route que nous suivons.
Le secret du succès de Taktarov est le progrès permanent vers la réalisation de son objectif.
Découvrez toutes les facettes de votre talent! Apprenez, essayez, commettez des erreurs, mais ne vous arrêtez pas!
InstaSpot - L'histoire de votre succès commence ici !
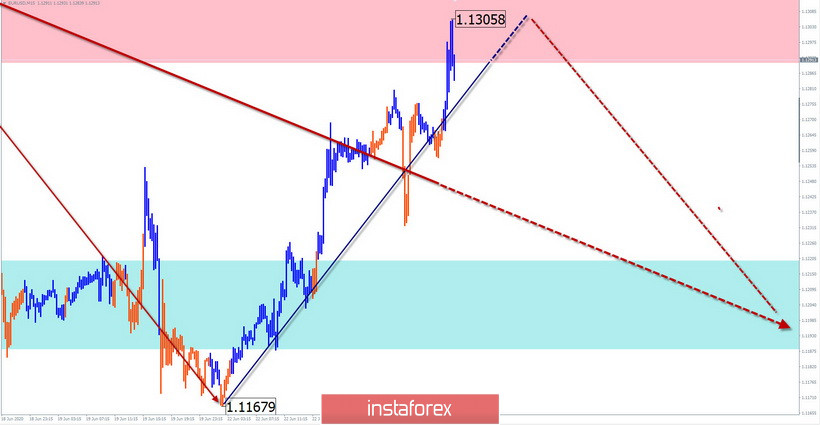
EUR/USD
Analysis:
The last incomplete wave structure of the European currency started on March 20. Since the beginning of May, the final part of the wave (C) has been developing. Within its framework, a flat correction has been formed in the last 3 weeks, which has not been completed yet.
Forecast:
Today, there is a high probability of price movement in the lateral plane between the nearest zones. In the European session, you can wait for the end of the rise. At the end of the day, the exchange rate is expected to change and the price will go down.
Potential reversal zones
Resistance:
- 1.1290/1.13280
Support:
- 1.1220/1.1190
Recommendations:
Trading the euro in the market today is possible within the intra-session style. Priority for the tool is sales.
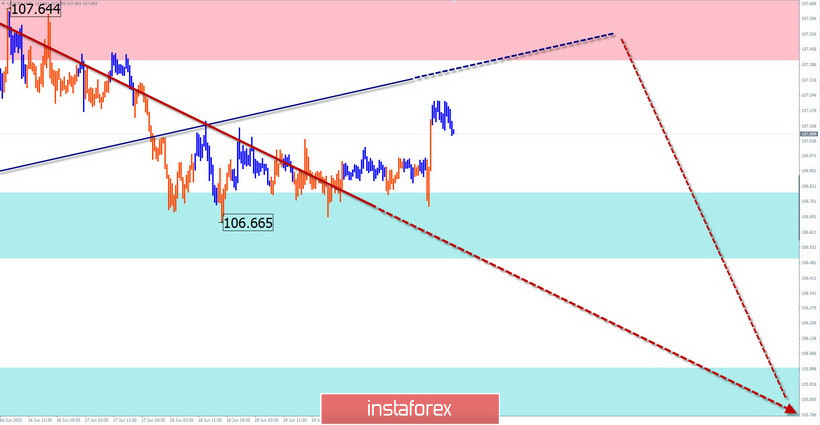
USD/JPY
Analysis:
The direction of the price movement of the Japanese yen since March 20 is set by the bearish wave algorithm. In the last 3 weeks, the price forms the final part of the design. Since last week, the price in the flat forms an intermediate correction.
Forecast:
In the first half of the day today, the end of the bullish section of movement that began yesterday is possible. By the end of the day, you can expect a change in the exchange rate and the price going down. If the nearest support breaks through, the next zone will become the target zone.
Potential reversal zones
Resistance:
- 107.40/107.70
Support:
- 106.80/106.50
- 106.00/105.70
Recommendations:
Purchases of the yen today can be very risky. The best tactic is to wait for the end of the rise and enter short positions on the instrument after the formation of reversal signals.
Explanation: In the simplified wave analysis (UVA), waves consist of 3 parts (A-B-C). The last incomplete wave is analyzed. The solid background of arrows shows the formed structure, and the dotted ones show the expected movements.
Note: The wave algorithm does not take into account the duration of the tool movements in time!
*The market analysis posted here is meant to increase your awareness, but not to give instructions to make a trade.
InstaSpot analytical reviews will make you fully aware of market trends! Being an InstaSpot client, you are provided with a large number of free services for efficient trading.


