


ทีมงานของพวกเรา พร้อมกับเทรดเดอร์มากกว่า 7,000,000 คน!
ในทุกวัน พวกเราได้รวมงานร่วมกันเพื่อพัฒนาการเทรด พวกเรามีผลตอบรับที่ดี และยังเดินหน้าต่อไป
การยอมรับจากเทรดเดอร์นับล้านจากทั่วทุกมุมโลกนั้นเป็น ผลงา่นอันน่าประทับใจมากที่สุดของพวกเรา! คุณเลือกตัวเลือก และพวกเราจะจัดการทุกอย่างให้ตรงกับการคาดหวังของคุณ !
พวกเราเป็นทีมงานที่ดีที่สุด!
InstaSpot รู้สึกเป็นเกียรติที่ได้ร่วมงานกับคุณ !


นักแสดง, แชมป์เปี้ยนทัวร์นาเม้น UFC 6 และฮิโรที่แท้จริง !
ชายผู้สามารถก่อร่างสร้างตัวขึ้นมาได้ด้วยตัวเขาเอง ชายผู้ที่นำพาเส้นทางให้พวกเรา
ความลับที่อยู่เบื้องหลังความสำเร็จของ Taktarov ก็คือการมุ่งหน้าไปสู่เป้าหมายแบบทันที
เปิดเผยทุกด้านของความสำเร็จคุณ !
ค้นพบ, พยายาม, ผิดพลาดได้ แต่อย่าพึ่งหยุดยั่ง !
InstaSpot ที่พร้อมจะเป็นจุดเริ่มต้น เรื่องราวความสำเร็จของคุณ !

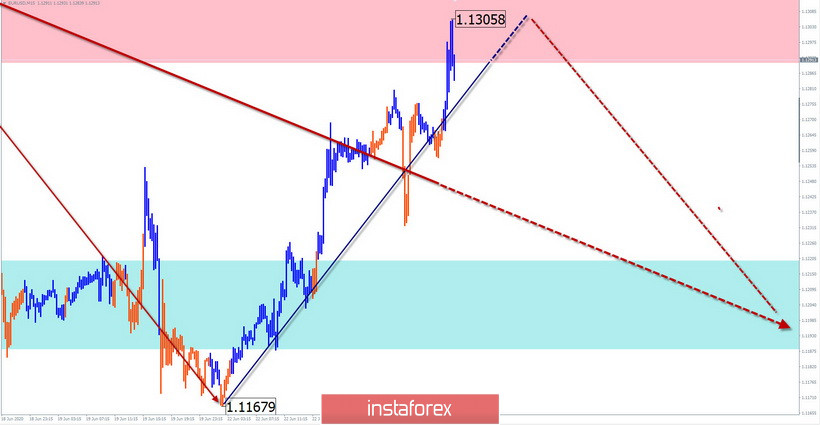
EUR/USD
Analysis:
The last incomplete wave structure of the European currency started on March 20. Since the beginning of May, the final part of the wave (C) has been developing. Within its framework, a flat correction has been formed in the last 3 weeks, which has not been completed yet.
Forecast:
Today, there is a high probability of price movement in the lateral plane between the nearest zones. In the European session, you can wait for the end of the rise. At the end of the day, the exchange rate is expected to change and the price will go down.
Potential reversal zones
Resistance:
- 1.1290/1.13280
Support:
- 1.1220/1.1190
Recommendations:
Trading the euro in the market today is possible within the intra-session style. Priority for the tool is sales.
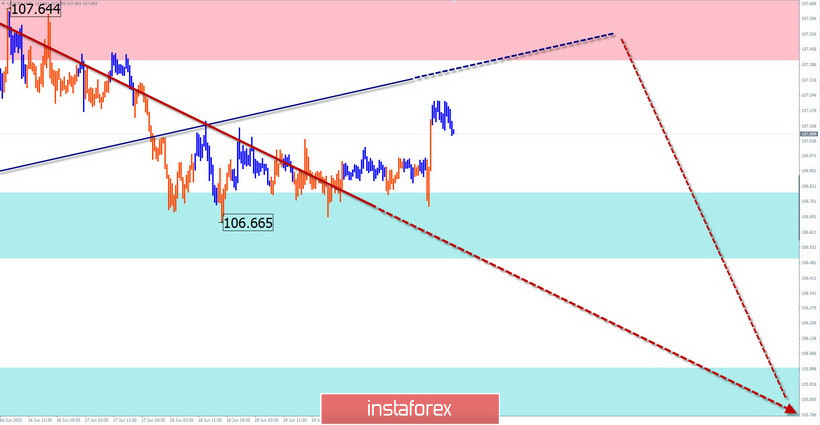
USD/JPY
Analysis:
The direction of the price movement of the Japanese yen since March 20 is set by the bearish wave algorithm. In the last 3 weeks, the price forms the final part of the design. Since last week, the price in the flat forms an intermediate correction.
Forecast:
In the first half of the day today, the end of the bullish section of movement that began yesterday is possible. By the end of the day, you can expect a change in the exchange rate and the price going down. If the nearest support breaks through, the next zone will become the target zone.
Potential reversal zones
Resistance:
- 107.40/107.70
Support:
- 106.80/106.50
- 106.00/105.70
Recommendations:
Purchases of the yen today can be very risky. The best tactic is to wait for the end of the rise and enter short positions on the instrument after the formation of reversal signals.
Explanation: In the simplified wave analysis (UVA), waves consist of 3 parts (A-B-C). The last incomplete wave is analyzed. The solid background of arrows shows the formed structure, and the dotted ones show the expected movements.
Note: The wave algorithm does not take into account the duration of the tool movements in time!
*บทวิเคราะห์ในตลาดที่มีการโพสต์ตรงนี้ เพียงเพื่อทำให้คุณทราบถึงข้อมูล ไม่ได้เป็นการเจาะจงถึงขั้นตอนให้คุณทำการซื้อขายตาม
บทวิเคราะห์ของทาง InstaSpot จะทำให้คุณทราบถึงแนวโน้มของตลาด! ในการที่เป็นลูกค้าของทาง InstaSpot นั้นคุณจะได้รับการบริการเพื่อการซื้อขายอย่างเต็มประสิทธิภาพอย่างมากมาย


