


Tim kami memiliki lebih dari 7.000.000 trader!
Setiap harinya kami bekerja sama untuk meningkatkan trading. Kami memperoleh hasil tinggi dan terus bergerak maju.
Pengakuan dari jutaan trader diseluruh dunia merupakan apresiasi terbaik dari kerja kami! Anda membuat pilihan anda dan kami akan melakukan semua yang dibutuhkan untuk memenuhi ekspektasi anda!
We are a great team together!
InstaSpot. Bangga bekerja bersama anda!


Seorang Aktor, juara 6 turnamen UFC dan pahlawan sesungguhnya!
Pria yang berhasil. Pria yang berusaha keras.
Rahasia dibalik kesuksesan Taktarov adalah pergerakan konstan menuju target.
Tunjukkan seluruh sisi dari bakat anda!
Temukan, coba, gagal - namun jangan pernah berhenti!
InstaSpot. Cerita sukses anda dimulai disini!

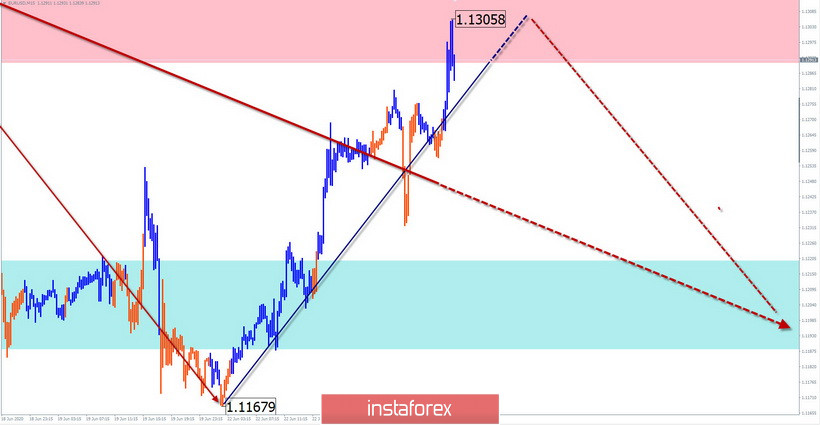
EUR/USD
Analysis:
The last incomplete wave structure of the European currency started on March 20. Since the beginning of May, the final part of the wave (C) has been developing. Within its framework, a flat correction has been formed in the last 3 weeks, which has not been completed yet.
Forecast:
Today, there is a high probability of price movement in the lateral plane between the nearest zones. In the European session, you can wait for the end of the rise. At the end of the day, the exchange rate is expected to change and the price will go down.
Potential reversal zones
Resistance:
- 1.1290/1.13280
Support:
- 1.1220/1.1190
Recommendations:
Trading the euro in the market today is possible within the intra-session style. Priority for the tool is sales.
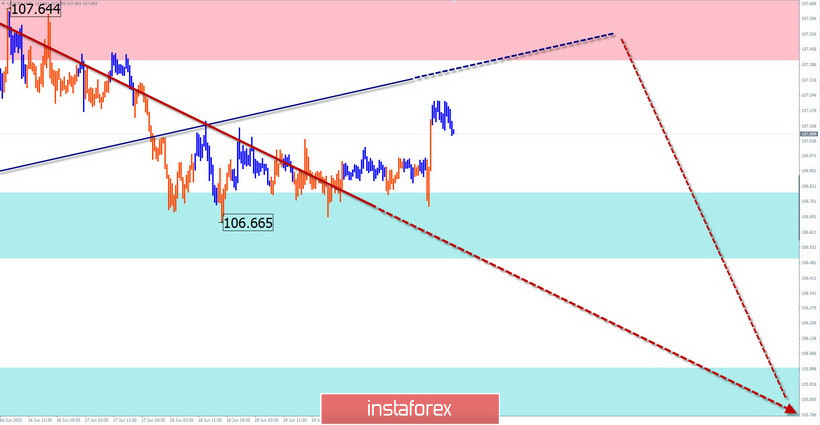
USD/JPY
Analysis:
The direction of the price movement of the Japanese yen since March 20 is set by the bearish wave algorithm. In the last 3 weeks, the price forms the final part of the design. Since last week, the price in the flat forms an intermediate correction.
Forecast:
In the first half of the day today, the end of the bullish section of movement that began yesterday is possible. By the end of the day, you can expect a change in the exchange rate and the price going down. If the nearest support breaks through, the next zone will become the target zone.
Potential reversal zones
Resistance:
- 107.40/107.70
Support:
- 106.80/106.50
- 106.00/105.70
Recommendations:
Purchases of the yen today can be very risky. The best tactic is to wait for the end of the rise and enter short positions on the instrument after the formation of reversal signals.
Explanation: In the simplified wave analysis (UVA), waves consist of 3 parts (A-B-C). The last incomplete wave is analyzed. The solid background of arrows shows the formed structure, and the dotted ones show the expected movements.
Note: The wave algorithm does not take into account the duration of the tool movements in time!
*Analisis pasar yang diposting disini dimaksudkan untuk meningkatkan pengetahuan Anda namun tidak untuk memberi instruksi trading.
Tinjauan analitis InstaSpot akan membuat Anda menyadari sepenuhnya tren pasar! Sebagai klien InstaSpot, Anda dilengkapi dengan sejumlah besar layanan gratis untuk trading yang efisien.


