




The legend in the InstaSpot team!
Legend! You think that's bombastic rhetoric? But how should we call a man, who became the first Asian to win the junior world chess championship at 18 and who became the first Indian Grandmaster at 19? That was the start of a hard path to the World Champion title for Viswanathan Anand, the man who became a part of history of chess forever. Now one more legend in the InstaSpot team!





Borussia is one of the most titled football clubs in Germany, which has repeatedly proved to fans: the spirit of competition and leadership will certainly lead to success. Trade in the same way that sports professionals play the game: confidently and actively. Keep a "pass" from Borussia FC and be in the lead with InstaSpot!

The EUR/USD currency pair showed a fairly decent rise on Friday, although it could have been much stronger. Not just "could," but "should." The reason is that the Non-Farm Payroll report is no longer just an important report; it will determine the fate of the Federal Reserve's monetary policy in the near future. Recall that last year, "the strongest economy in the world" was creating about 18,000 jobs per month. Under Joe Biden, this figure fluctuated between 120,000 and 150,000. The Fed cut the key interest rate three times at the end of 2025, and as 2026 began, the indicator confidently started to increase. For example, in January, 160,000 jobs were created, and in March—214,000. February was a failure, but the negative figure of -156,000 was attributed to mass strikes. Since April, Non-Farm Payrolls have begun to decline again. The numbers have decreased every month: 148,000, 63,000, 20,000, -23,000. This is no longer a one-time occurrence or a trivial coincidence; it is a clear downward trend.
Additionally, it's noteworthy that the US Bureau of Statistics once again revised its previous month's data downward. Under Donald Trump, revisions almost always occur for lesser figures, with April and May figures revised down by as much as 100,000 jobs. We have repeatedly pointed out that the Non-Farm Payrolls figure only seems accurate. In reality, it is revisited monthly and can even be changed at the end of the year. Therefore, if it is hypothetically stated that in March there were 200,000 jobs created, it does not necessarily mean that 200,000 jobs were indeed created that month.
As a result, the July figure turned out negative and fell short of projections by 100,000. The revised values for June and May were also adjusted downward by 100,000. In response to this total failure, the market reacted by selling the dollar by 50 pips... In our view, this is "laughable." What value does the July report have? It's simple: since the US labor market is "in the out," the chances of the Fed conducting monetary policy tightening in September are minimal. And there is no need to look at various indicators, like FedWatch. They are as precise as Non-Farm Payrolls. Today it might show an 80% probability of a rate hike, and a week later—10%.
The market already believed in June that the Fed would inevitably raise rates in 2026. We warned that this was unlikely. Now, the market itself is coming to this conclusion. If the Fed abandons its plans for policy tightening, the labor market continues to weaken, and the economy slows down, what should we expect from the US dollar? The same as in 2025—a decline. Geopolitics provided strong support for the US currency in the first half of the current year, but Trump continues to lead America into a bright future. Hence, the dollar will continue to weaken in the long term.
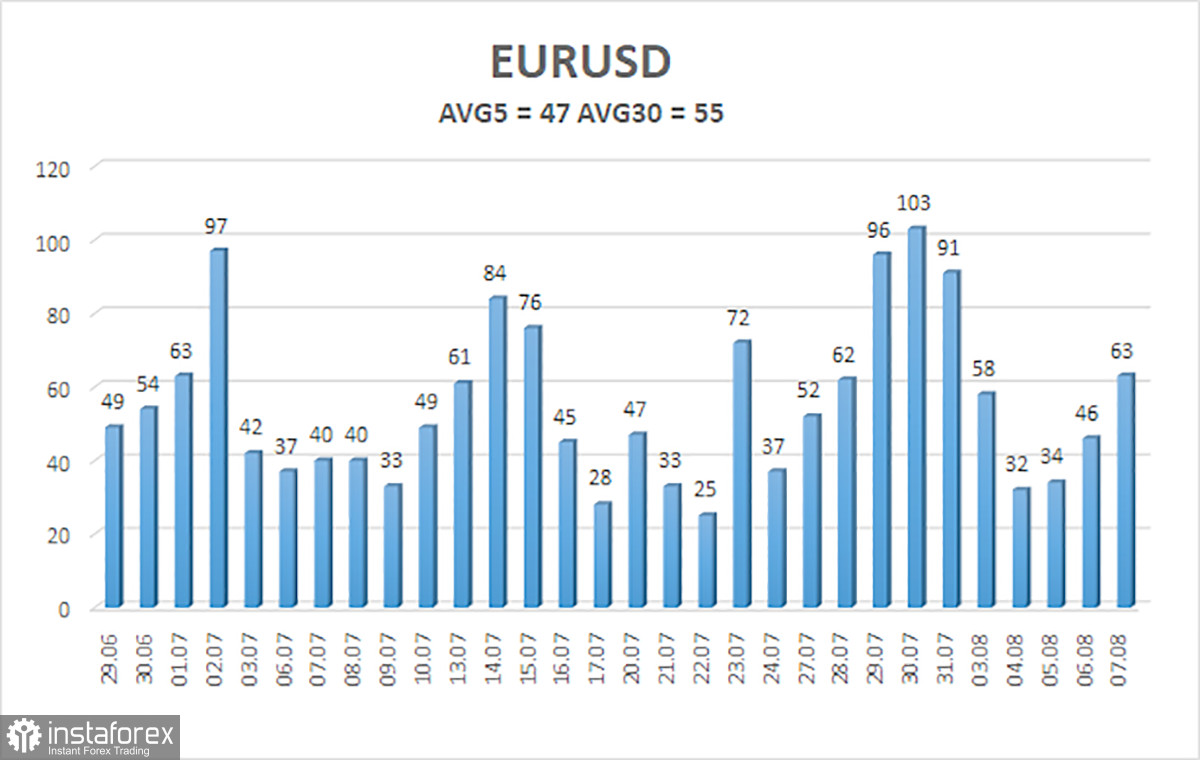
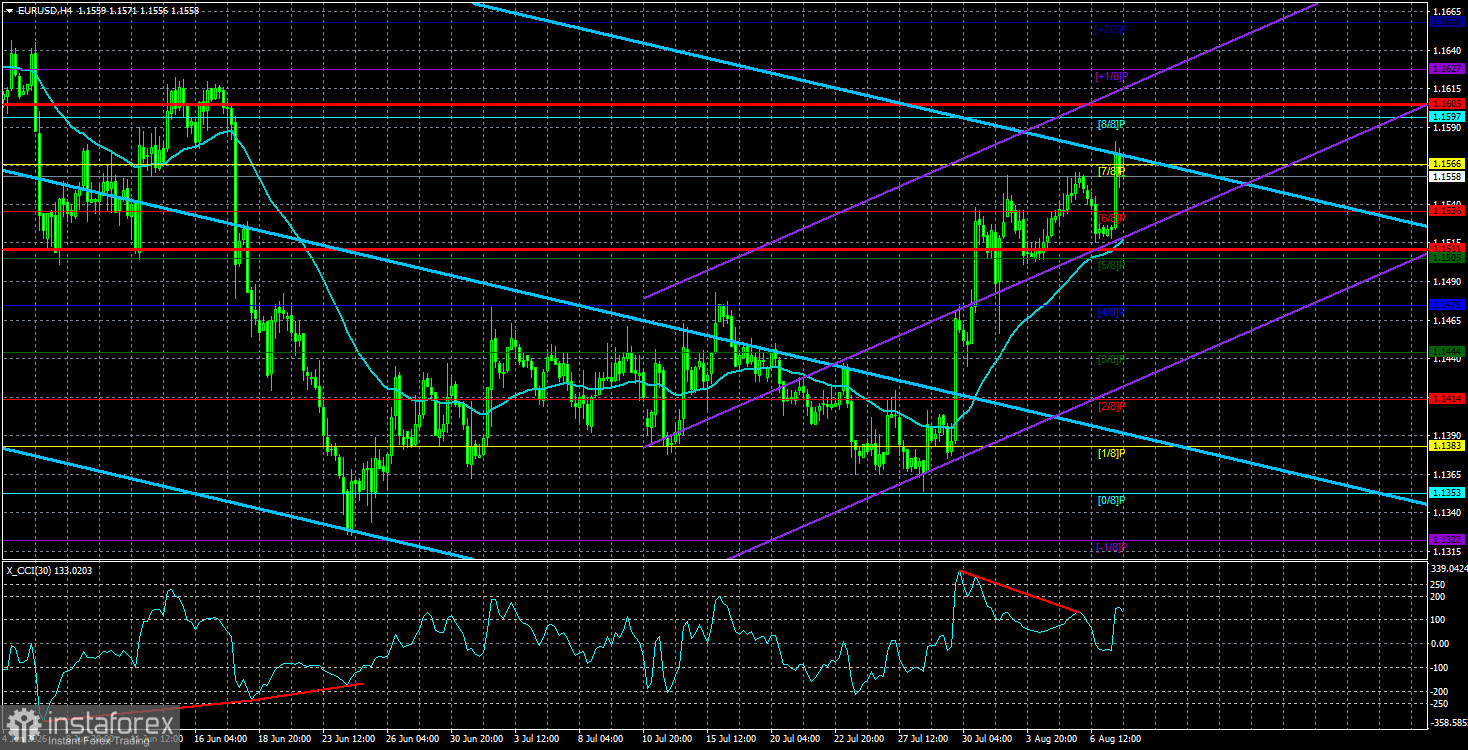
The average volatility of the EUR/USD currency pair over the last five trading days, as of August 10, is 47 pips and is characterized as "medium-low." We expect the pair to move between 1.1511 and 1.1605 on Monday. The upper linear regression channel points downward, indicating the continuation of a downtrend. The CCI indicator has entered overbought territory and formed a "bearish" divergence, signaling a potential downward correction.
S1 – 1.1536
S2 – 1.1505
S3 – 1.1475
R1 – 1.1566
R2 – 1.1597
R3 – 1.1627
The EUR/USD pair has begun a new upward trend on the 4-hour timeframe, which may signal the start of a new phase in the global upward trend on higher timeframes. The global fundamental backdrop for the dollar remains negative, but in 2026 geopolitical factors and the Fed's "hawkish" stance have provided strong support for the US currency. However, every fairytale eventually comes to an end. When the price is below the moving average, short positions can be considered with targets at 1.1475 and 1.1444. Above the moving average line, long positions are relevant with targets at 1.1597 and 1.1605.
*The market analysis posted here is meant to increase your awareness, but not to give instructions to make a trade.
InstaSpot analytical reviews will make you fully aware of market trends! Being an InstaSpot client, you are provided with a large number of free services for efficient trading.


