


The legend in the InstaSpot team!
Legend! You think that's bombastic rhetoric? But how should we call a man, who became the first Asian to win the junior world chess championship at 18 and who became the first Indian Grandmaster at 19? That was the start of a hard path to the World Champion title for Viswanathan Anand, the man who became a part of history of chess forever. Now one more legend in the InstaSpot team!


Borussia is one of the most titled football clubs in Germany, which has repeatedly proved to fans: the spirit of competition and leadership will certainly lead to success. Trade in the same way that sports professionals play the game: confidently and actively. Keep a "pass" from Borussia FC and be in the lead with InstaSpot!


Brent is struggling to stay afloat, even as looming strikes on Iran and new turns in U.S. sanctions diplomacy come into view. Meanwhile, natural gas is currently in a bind due to decreasing demand and the unpredictable nature of a technical correction. Let's break down the forces behind this fragile balance and where the price pendulum might swing next.
The oil market now resembles a chess match played on three boards: politics, demand, and inventories.
In this atmosphere of realpolitik, Donald Trump is re-emerging as a pricing factor. According to a Goldman Sachs study that analyzed over 900 of his tweets, Trump's "comfort zone" for oil prices is $40–50 per barrel.
In other words, with Brent currently at $65–66, Washington is likely to engage in direct and indirect efforts to bring prices down, especially ahead of a presidential visit to Qatar and the UAE, where "price stability" is an unspoken prerequisite for energy partnerships.
That said, Brent is holding at two-week highs for a reason:
These positive factors offset the bearish surprise from the latest API data, which showed a +4.29 million barrel increase in U.S. crude stocks (versus expectations of a 2.4 million barrel decline). The next key data point is the official EIA report.
Brent is clinging to key resistance at the $66.00–66.50 zone and still targets a breakout toward $68.50, a former sell-off area. Immediate support lies at $65.60.
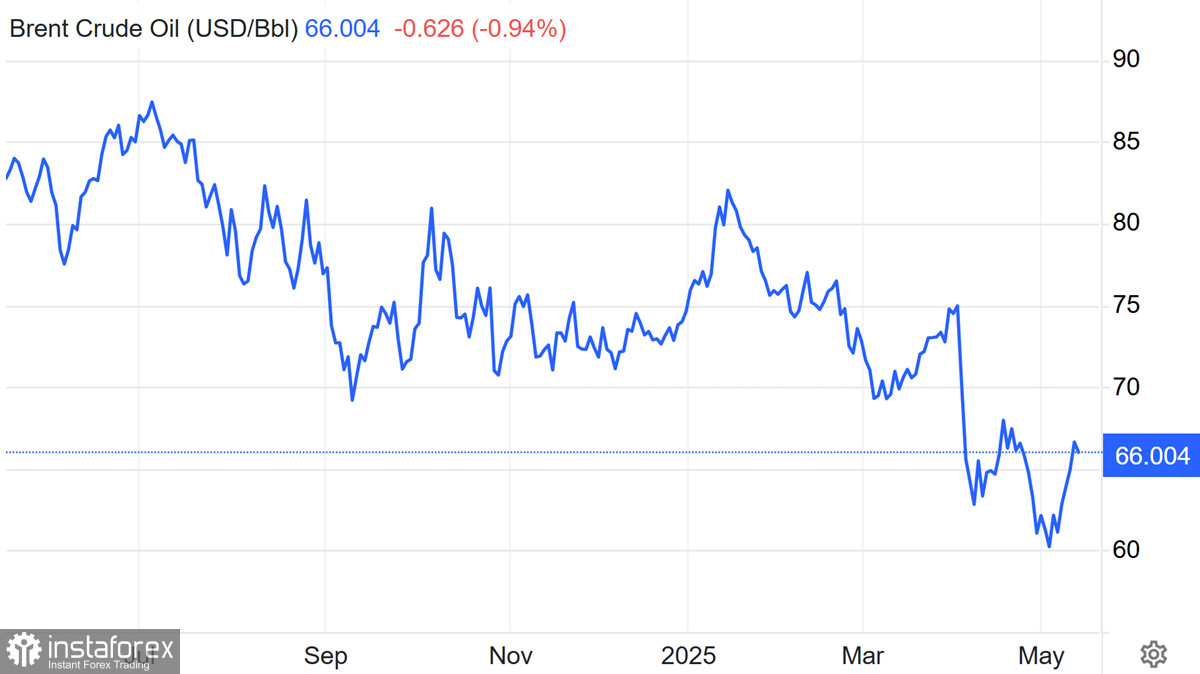
Below is the $64.20 level—April's launchpad for the previous upward impulse. If EIA data disappoints, we could see a break below $65.60 and a downward correction.
But for now, the market structure suggests potential for further upward movement, mainly due to a "geopolitical premium."
Due to scheduled maintenance at LNG export facilities, natural gas slipped below $3.60/MMBtu amid softening demand. Cameron LNG, Cheniere, and Freeport have temporarily throttled output, reducing average U.S. LNG exports to 15.1 billion cubic feet/day, down from the April peak of 16.0 bcf/d.
This sharp drop in short-term demand hasn't changed the fundamental story—the U.S. remains the global LNG leader, and summer electricity demand is just around the corner.
Technically, gas is trapped in a triangle between descending resistance and horizontal support at $3.566. The upper boundary lies at $3.726. A breakout from this pattern will define the next major move.
Currently, a bearish bias prevails in the short term; however, if the bulls gain momentum, a significant rally towards $3.85 or higher could occur.
Both oil and gas are at the crossroads of geopolitics and supply-demand data. The key is to follow the trend and stay alert to headlines, especially when that direction is influenced by a man with golden tweets and a strategy that states, "Brent at $45—no surprises."
*The market analysis posted here is meant to increase your awareness, but not to give instructions to make a trade.
InstaSpot analytical reviews will make you fully aware of market trends! Being an InstaSpot client, you are provided with a large number of free services for efficient trading.


