


Our team has over 7,000,000 traders!
Every day we work together to improve trading. We get high results and move forward.
Recognition by millions of traders all over the world is the best appreciation of our work! You made your choice and we will do everything it takes to meet your expectations!
We are a great team together!
InstaSpot. Proud to work for you!


Actor, UFC 6 tournament champion and a true hero!
The man who made himself. The man that goes our way.
The secret behind Taktarov's success is constant movement towards the goal.
Reveal all the sides of your talent!
Discover, try, fail - but never stop!
InstaSpot. Your success story starts here!

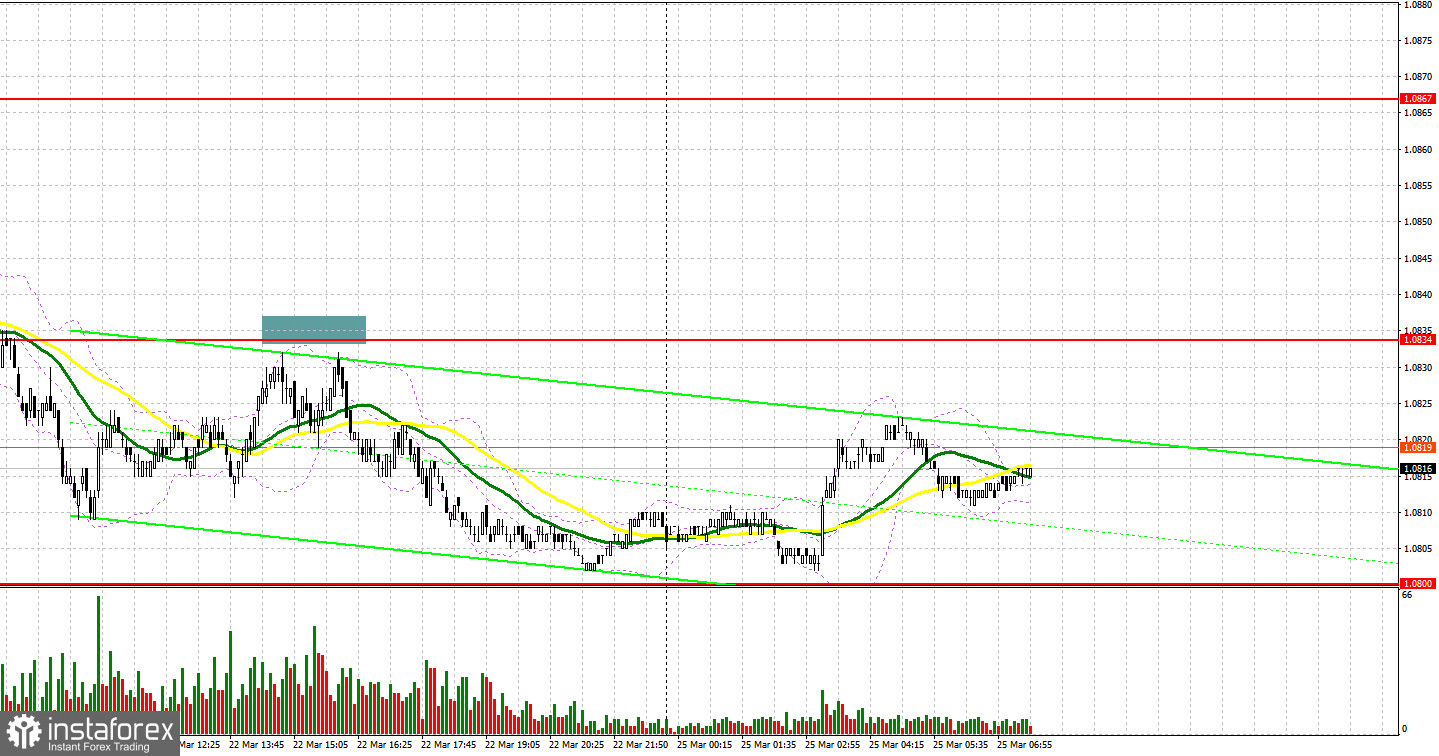
Last Friday, several market entry signals were generated to enter the market. Let's have a look at what happened on the 5-minute chart. In my morning review, I mentioned the level of 1.0826 as a possible entry point. The pair fell, but I did not wait for a false breakout to form on this mark. Therefore, we did not get any good entry points. In the afternoon, although we fell short of reaching the level of 1.0834 by a point, after the price approached this range for the second time, a sell signal was formed, which sent the pair down by more than 30 pips.
What is needed to open long positions on EUR/USD
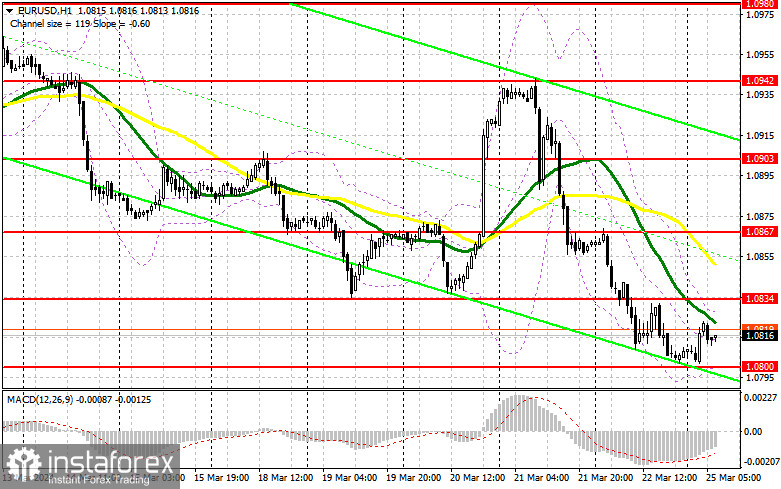
The decline in Eurozone inflation exerted pressure on the euro. Today, European Central Bank President Christine Lagarde will speak, and she may comment on the latest inflation report. This may lead to a new euro sell-off and support the bear market. For this reason, I am not in a rush to buy. Hence, an optimal buying opportunity might arise on dips after a false breakout near the nearest support at 1.0800, which the bears were not strong enough to test last Friday. This will be a proper condition for buying in anticipation of a small correction to the area of 1.0834 - the resistance established last Friday. A breakout and a downward test of this range will lead to strengthening the pair, giving a chance to buy during a climb to 1.0867. The farthest target will be the 1.0903 high, where I will take profit. If EUR/USD declines and there is no activity around 1.0800, the selling pressure on the euro will increase, which will lead to a larger drop with the prospect of testing 1.0763. I plan to enter the market there only after a false breakout has formed. I will open long positions immediately on a rebound from 1.0735, bearing in mind an upward correction of 30-35 pips within the day.
What is needed to open short positions on EUR/USD
Although the euro managed to recover in today's Asian session, it is obvious that the sellers are still around. In case the pair grows, defending the nearest resistance at 1.0834 with a false breakout, along with a dovish stance from Lagarde, would confirm the presence of major sellers in the market, creating a sell signal with the prospect of testing the new support at 1.0800. A breakout and consolidation below this range, as well as an upward retest, will provide another selling point during a slide of the price to 1.0763, where buyers will become more active. The farthest target will be the 1.0735 low, where I will take profits. If EUR/USD moves up in the first half of the day, and the bears do not show up at 1.0834, buyers will get a chance to push the pair higher at the beginning of the week. In this case, I will postpone selling until the test of the next resistance at 1.0867. I will also sell there, but only after an unsuccessful consolidation. I plan to open short positions immediately on a rebound from 1.0903, bearing in mind a downward correction of 30-35 pips.
COT report:
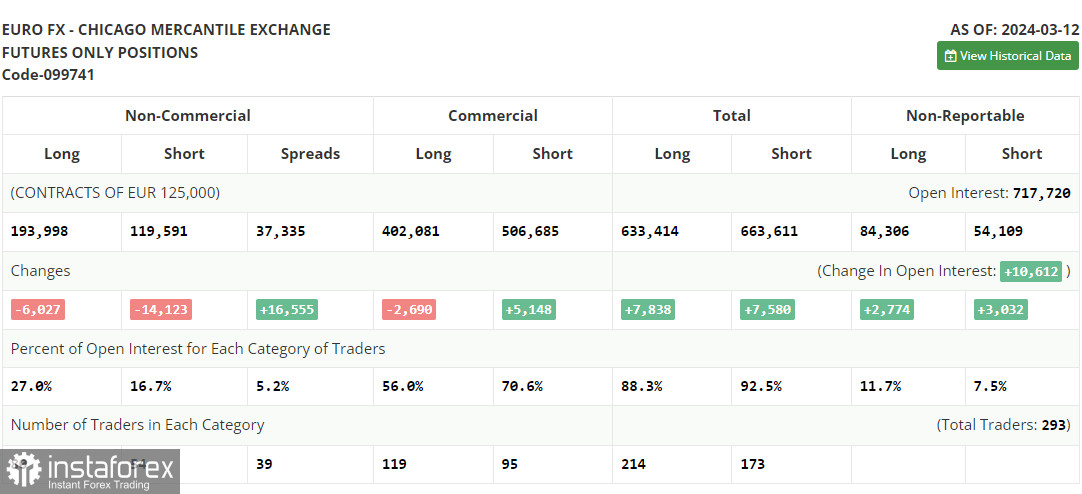
The March 12 COT report showed a reduction in both long and short positions. The outcome of the European Central Bank meeting continued to exert pressure on risk assets, as traders have not received any particular details about the Bank's plans. In addition, the US inflation data convinced market participants that it is still too early for the Federal Reserve to consider rate cuts. For this reason, I am hoping that the US dollar will start a firm uptrend while the euro falls. The COT report revealed a decline in non-commercial long positions by 6,027 to 193,998, whereas non-commercial short positions fell by 14,123 to 119,591, expanding the spread between long and short positions by 16,555.
Indicators' signals
Moving averages
Trading below the 30- and 50-day moving averages indicates that the pair is falling.
Note: The period and prices of the moving averages are considered by the analyst on the 1-hour chart and differ from the general definition of classic daily moving averages on the daily chart.
Bollinger Bands
In case EUR/USD goes down, the indicator's lower border near 1.0800 will act as support.
Description of indicators
*The market analysis posted here is meant to increase your awareness, but not to give instructions to make a trade.
InstaSpot analytical reviews will make you fully aware of market trends! Being an InstaSpot client, you are provided with a large number of free services for efficient trading.


