


Our team has over 7,000,000 traders!
Every day we work together to improve trading. We get high results and move forward.
Recognition by millions of traders all over the world is the best appreciation of our work! You made your choice and we will do everything it takes to meet your expectations!
We are a great team together!
InstaSpot. Proud to work for you!


Actor, UFC 6 tournament champion and a true hero!
The man who made himself. The man that goes our way.
The secret behind Taktarov's success is constant movement towards the goal.
Reveal all the sides of your talent!
Discover, try, fail - but never stop!
InstaSpot. Your success story starts here!

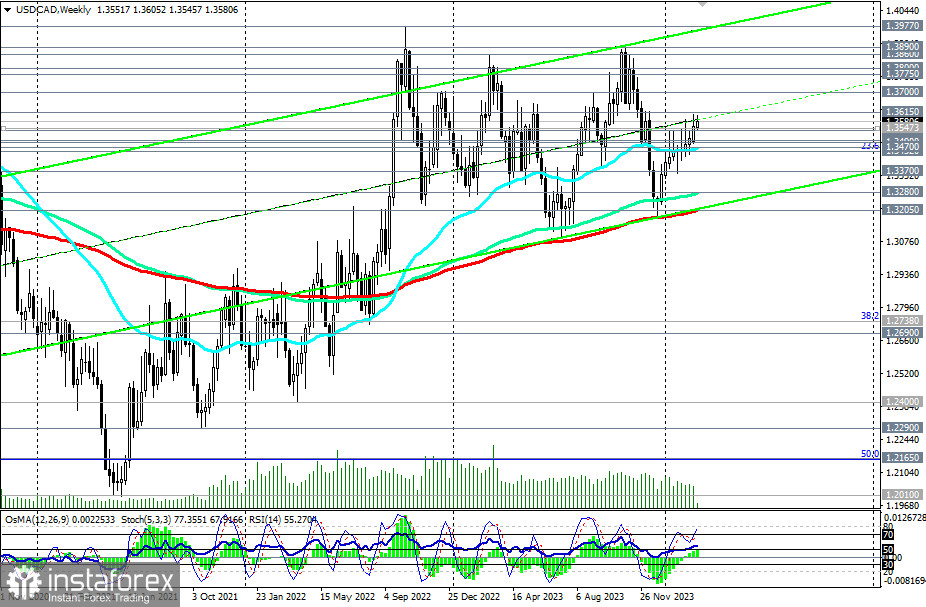
Having overcome the resistance zone around the 1.3500 mark last month, USD/CAD continues to demonstrate positive dynamics in March, moving within upward channels on daily and weekly charts.
Now, the nearest resistance is located at the 1.3600 mark, through which the upper line of the upward channel on the daily chart passes.
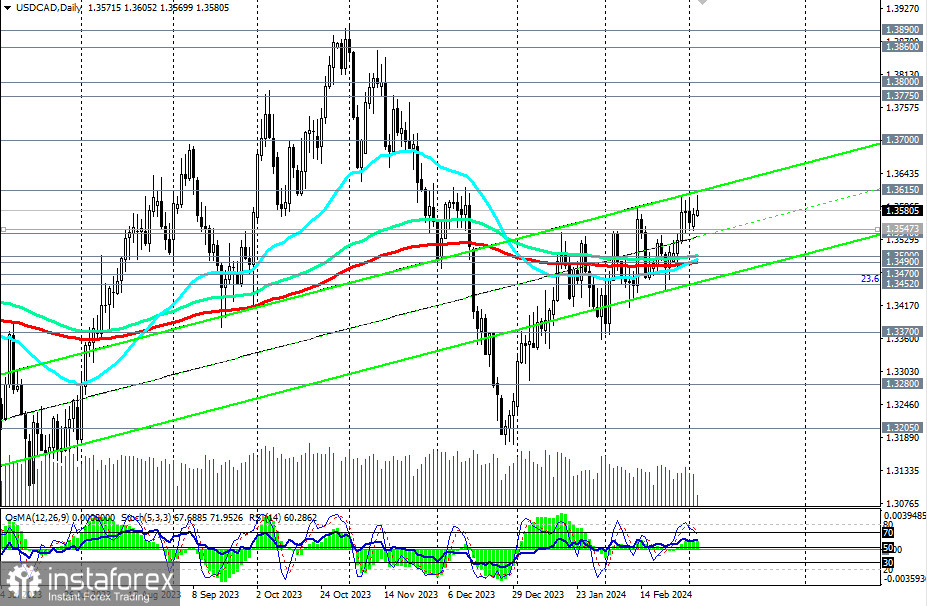
In the event of breaking through the said level, USD/CAD will head towards the upper boundary of the upward channel on the weekly chart and the highs of October–November of the previous year, near the 1.3900 mark. Intermediate targets, in this case, will be located near the marks 1.3700, 1.3780, 1.3800, and 1.3860.
In an alternative scenario, a decline of the pair within the aforementioned upward channels and towards key supports at levels 1.3500 and 1.3490 may resume.
Their breakthrough and the breach of the important support level of 1.3452 (23.6% Fibonacci correction level in the growth wave from the level of 0.9700 to the level of 1.4600, reached in June 2016) will return USD/CAD to the medium-term bearish market zone.
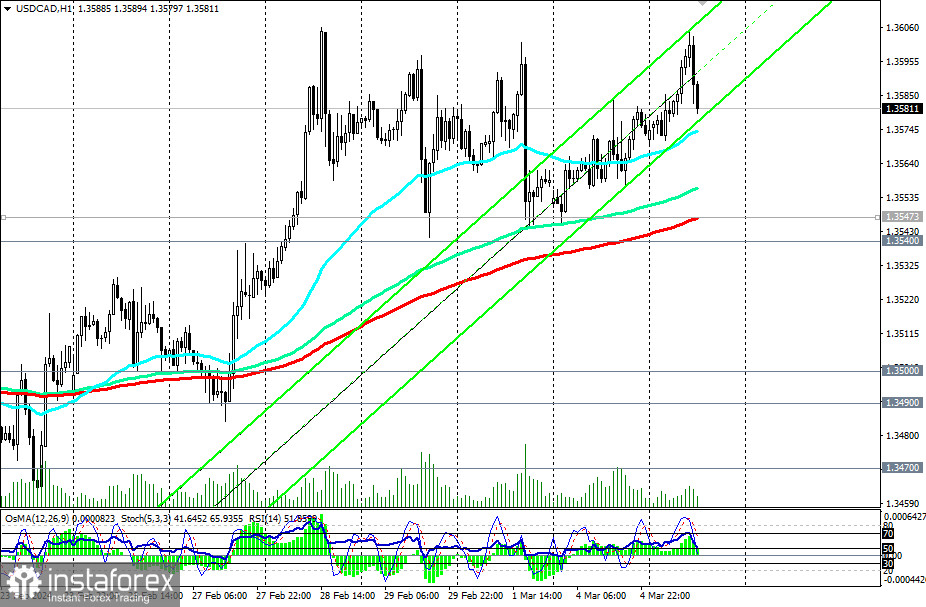
The first signal for the implementation of this scenario may be the breakthrough of today's low of 1.3570, and the confirming signal will be the breakthrough of the short-term support level of 1.3547 (200 EMA on the 1-hour chart).
Support levels: 1.3570, 1.3547, 1.3540, 1.3500, 1.3490, 1.3470, 1.3452, 1.3400, 1.3370, 1.3300, 1.3280, 1.3205
Resistance levels: 1.3600, 1.3615, 1.3700, 1.3775, 1.3800, 1.3860, 1.3890, 1.3900, 1.3970, 1.4000
Trading scenarios
Main scenario: Buy at the market, Buy Stop 1.3620. Stop-Loss 1.3560. Targets 1.3700, 1.3775, 1.3800, 1.3860, 1.3890, 1.3900, 1.3970, 1.4000
Alternative scenario: Sell Stop 1.3560. Stop-Loss 1.3620. Targets 1.3550, 1.3540, 1.3500, 1.3490, 1.3470, 1.3452, 1.3400, 1.3370, 1.3300, 1.3280, 1.3200
"Targets" correspond to support/resistance levels. This also does not mean that they will necessarily be reached, but they can serve as a guide when planning and placing trading positions.
*The market analysis posted here is meant to increase your awareness, but not to give instructions to make a trade.
InstaSpot analytical reviews will make you fully aware of market trends! Being an InstaSpot client, you are provided with a large number of free services for efficient trading.


