


The legend in the InstaSpot team!
Legend! You think that's bombastic rhetoric? But how should we call a man, who became the first Asian to win the junior world chess championship at 18 and who became the first Indian Grandmaster at 19? That was the start of a hard path to the World Champion title for Viswanathan Anand, the man who became a part of history of chess forever. Now one more legend in the InstaSpot team!


Borussia is one of the most titled football clubs in Germany, which has repeatedly proved to fans: the spirit of competition and leadership will certainly lead to success. Trade in the same way that sports professionals play the game: confidently and actively. Keep a "pass" from Borussia FC and be in the lead with InstaSpot!

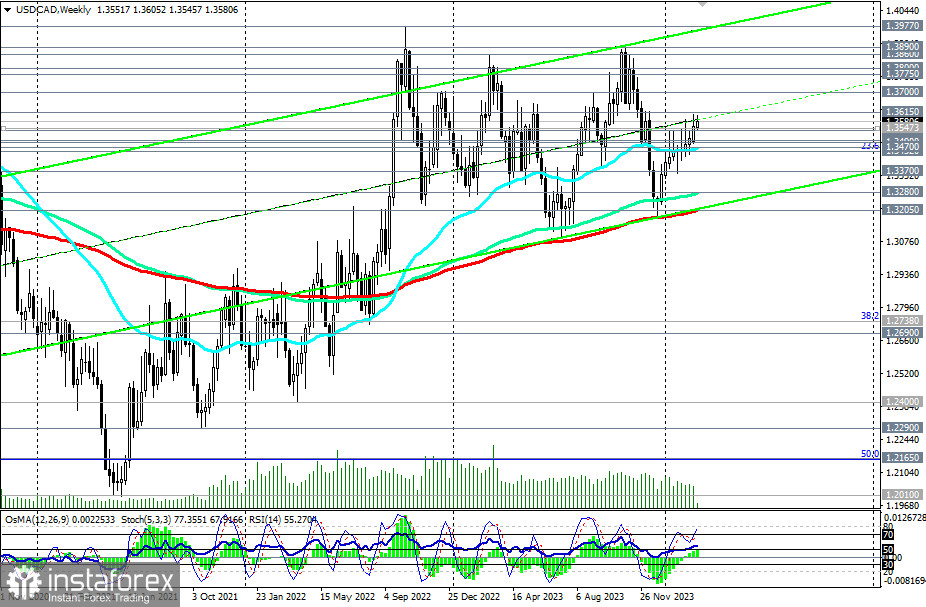
Having overcome the resistance zone around the 1.3500 mark last month, USD/CAD continues to demonstrate positive dynamics in March, moving within upward channels on daily and weekly charts.
Now, the nearest resistance is located at the 1.3600 mark, through which the upper line of the upward channel on the daily chart passes.
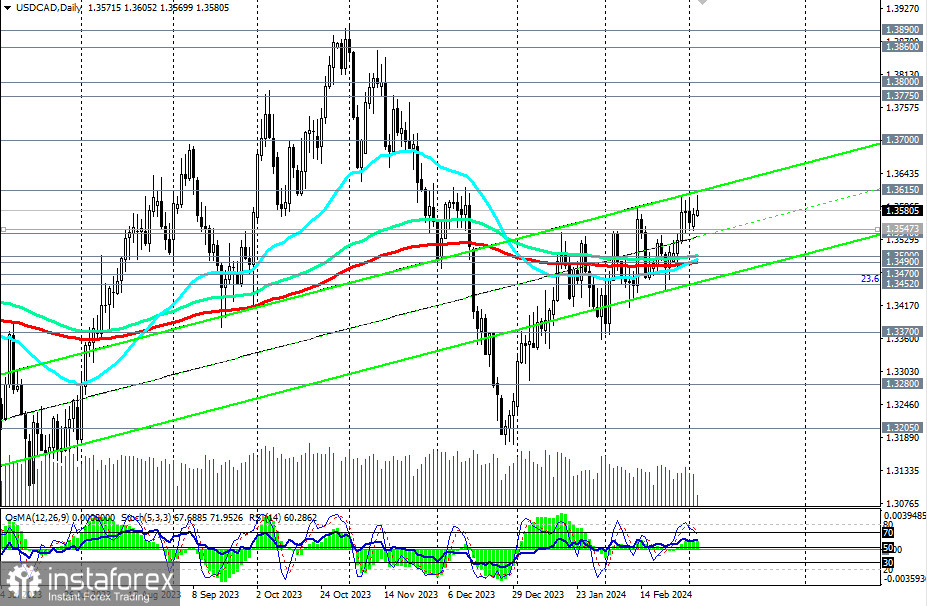
In the event of breaking through the said level, USD/CAD will head towards the upper boundary of the upward channel on the weekly chart and the highs of October–November of the previous year, near the 1.3900 mark. Intermediate targets, in this case, will be located near the marks 1.3700, 1.3780, 1.3800, and 1.3860.
In an alternative scenario, a decline of the pair within the aforementioned upward channels and towards key supports at levels 1.3500 and 1.3490 may resume.
Their breakthrough and the breach of the important support level of 1.3452 (23.6% Fibonacci correction level in the growth wave from the level of 0.9700 to the level of 1.4600, reached in June 2016) will return USD/CAD to the medium-term bearish market zone.
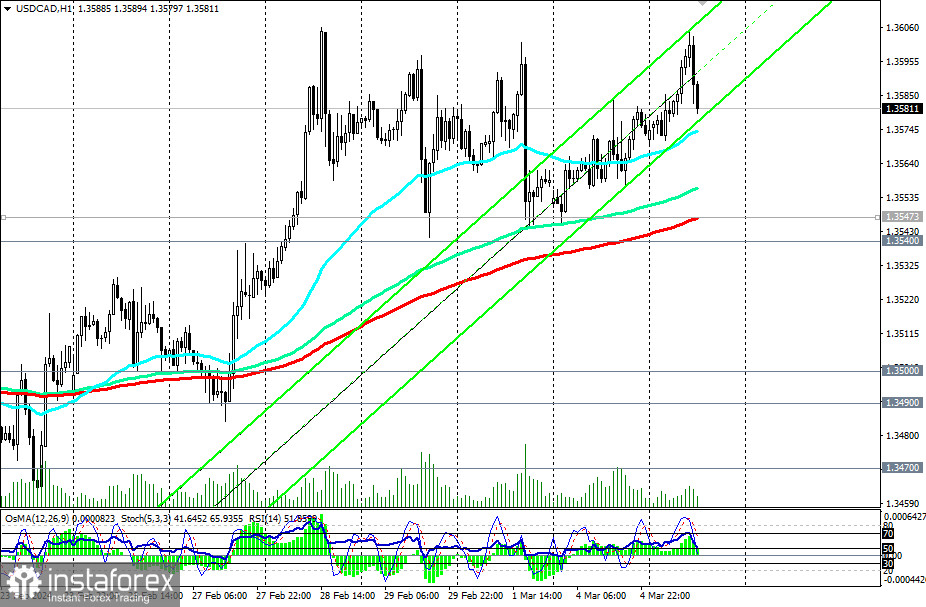
The first signal for the implementation of this scenario may be the breakthrough of today's low of 1.3570, and the confirming signal will be the breakthrough of the short-term support level of 1.3547 (200 EMA on the 1-hour chart).
Support levels: 1.3570, 1.3547, 1.3540, 1.3500, 1.3490, 1.3470, 1.3452, 1.3400, 1.3370, 1.3300, 1.3280, 1.3205
Resistance levels: 1.3600, 1.3615, 1.3700, 1.3775, 1.3800, 1.3860, 1.3890, 1.3900, 1.3970, 1.4000
Trading scenarios
Main scenario: Buy at the market, Buy Stop 1.3620. Stop-Loss 1.3560. Targets 1.3700, 1.3775, 1.3800, 1.3860, 1.3890, 1.3900, 1.3970, 1.4000
Alternative scenario: Sell Stop 1.3560. Stop-Loss 1.3620. Targets 1.3550, 1.3540, 1.3500, 1.3490, 1.3470, 1.3452, 1.3400, 1.3370, 1.3300, 1.3280, 1.3200
"Targets" correspond to support/resistance levels. This also does not mean that they will necessarily be reached, but they can serve as a guide when planning and placing trading positions.
*এখানে পোস্ট করা মার্কেট বিশ্লেষণ আপনার সচেতনতা বৃদ্ধির জন্য প্রদান করা হয়, ট্রেড করার নির্দেশনা প্রদানের জন্য প্রদান করা হয় না।
ইন্সটাফরেক্স বিশ্লেষণমূলক পর্যালোচনাগুলো আপনাকে মার্কেট প্রবণতা সম্পর্কে পুরোপুরি সচেতন করবে! ইন্সটাফরেক্সের একজন গ্রাহক হওয়ায়, দক্ষ ট্রেডিং এর জন্য আপনাকে অনেক সেবা বিনামূল্যে প্রদান করা হয়।


