


Nella nostra squadra ci sono più di 7.000.000 trader! Ogni giorno ci impegniamo a far sì che il trading migliori. Conseguiamo grandi risultati e ci muoviamo in avanti.
Il riconoscimento da parte di milioni di trader in tutto il mondo rappresenta l'alta valutazione della nostra attività! Voi avete fatto la vostra scelta e noi faremo la nostra al fine di soddisfare le vostre aspettative!
Assieme siamo una grande squadra!
InstaSpot. Siamo orgogliosi di lavorare per voi!


Attore, campione del mondo di lotta libera e semplicemente un vero maciste russo! Persona venuta dal nulla. Persona che rispecchia i nostri obiettivi. Il segreto del successo di Taktarov consiste nel mirare continuamente al suo scopo.
Dischiudi anche tu tutti gli aspetti del tuo talento! Impara, prova, sbaglia, ma non fermarti!
InstaSpot - la storia delle tue vittorie inizia qui!

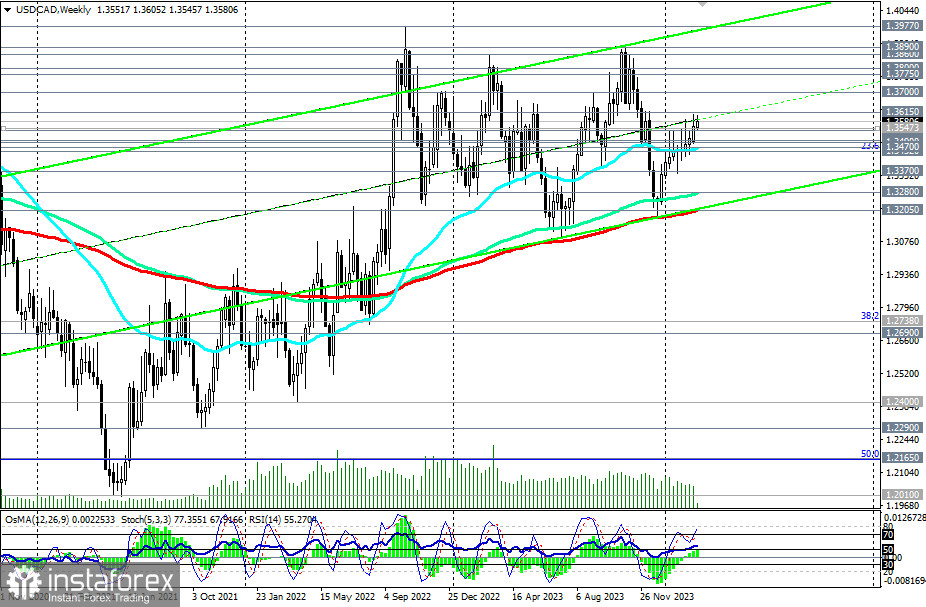
Having overcome the resistance zone around the 1.3500 mark last month, USD/CAD continues to demonstrate positive dynamics in March, moving within upward channels on daily and weekly charts.
Now, the nearest resistance is located at the 1.3600 mark, through which the upper line of the upward channel on the daily chart passes.
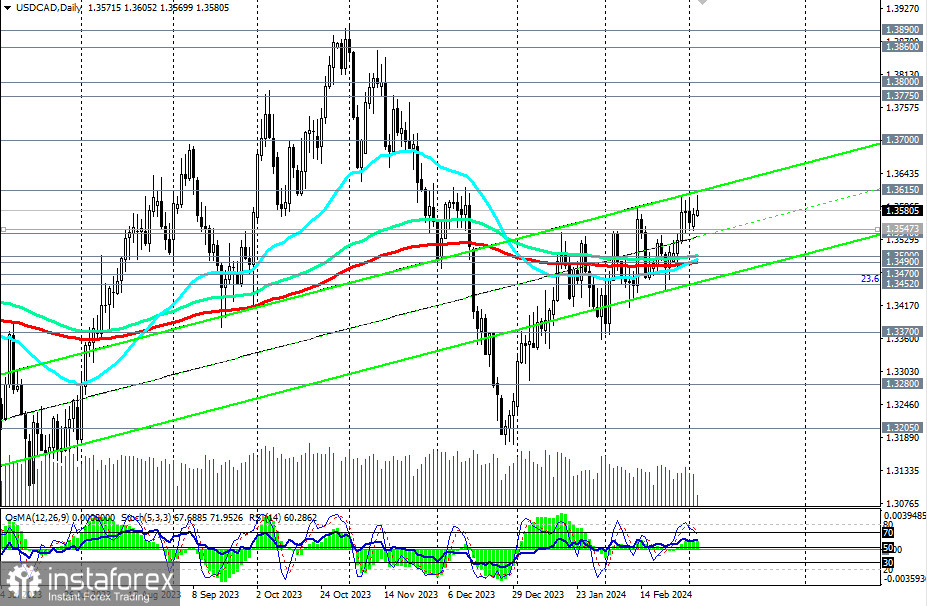
In the event of breaking through the said level, USD/CAD will head towards the upper boundary of the upward channel on the weekly chart and the highs of October–November of the previous year, near the 1.3900 mark. Intermediate targets, in this case, will be located near the marks 1.3700, 1.3780, 1.3800, and 1.3860.
In an alternative scenario, a decline of the pair within the aforementioned upward channels and towards key supports at levels 1.3500 and 1.3490 may resume.
Their breakthrough and the breach of the important support level of 1.3452 (23.6% Fibonacci correction level in the growth wave from the level of 0.9700 to the level of 1.4600, reached in June 2016) will return USD/CAD to the medium-term bearish market zone.
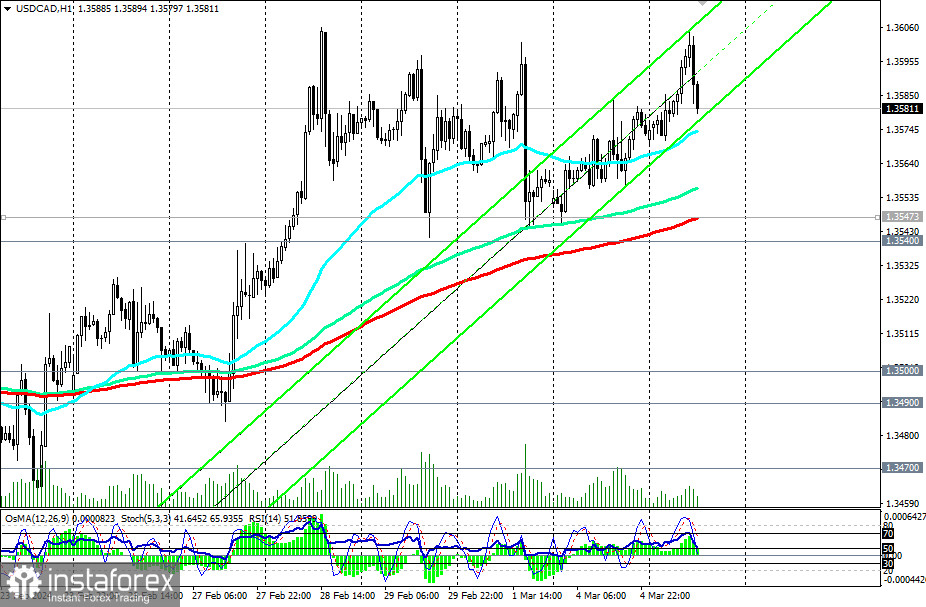
The first signal for the implementation of this scenario may be the breakthrough of today's low of 1.3570, and the confirming signal will be the breakthrough of the short-term support level of 1.3547 (200 EMA on the 1-hour chart).
Support levels: 1.3570, 1.3547, 1.3540, 1.3500, 1.3490, 1.3470, 1.3452, 1.3400, 1.3370, 1.3300, 1.3280, 1.3205
Resistance levels: 1.3600, 1.3615, 1.3700, 1.3775, 1.3800, 1.3860, 1.3890, 1.3900, 1.3970, 1.4000
Trading scenarios
Main scenario: Buy at the market, Buy Stop 1.3620. Stop-Loss 1.3560. Targets 1.3700, 1.3775, 1.3800, 1.3860, 1.3890, 1.3900, 1.3970, 1.4000
Alternative scenario: Sell Stop 1.3560. Stop-Loss 1.3620. Targets 1.3550, 1.3540, 1.3500, 1.3490, 1.3470, 1.3452, 1.3400, 1.3370, 1.3300, 1.3280, 1.3200
"Targets" correspond to support/resistance levels. This also does not mean that they will necessarily be reached, but they can serve as a guide when planning and placing trading positions.
*La presente analisi del mercato ha un carattere esclusivamente informativo e non rappresenta una guida per l`effettuazione di una transazione.
Le recensioni analitiche di InstaSpot ti renderanno pienamente consapevole delle tendenze del mercato! Essendo un cliente InstaSpot, ti viene fornito un gran numero di servizi gratuiti per il trading efficiente.


