


Our team has over 7,000,000 traders!
Every day we work together to improve trading. We get high results and move forward.
Recognition by millions of traders all over the world is the best appreciation of our work! You made your choice and we will do everything it takes to meet your expectations!
We are a great team together!
InstaSpot. Proud to work for you!


Actor, UFC 6 tournament champion and a true hero!
The man who made himself. The man that goes our way.
The secret behind Taktarov's success is constant movement towards the goal.
Reveal all the sides of your talent!
Discover, try, fail - but never stop!
InstaSpot. Your success story starts here!

Market participants are assessing the macroeconomic data coming from the U.S., trying to predict both the likelihood of a recession in the American economy and the actions of the Federal Reserve under current conditions.
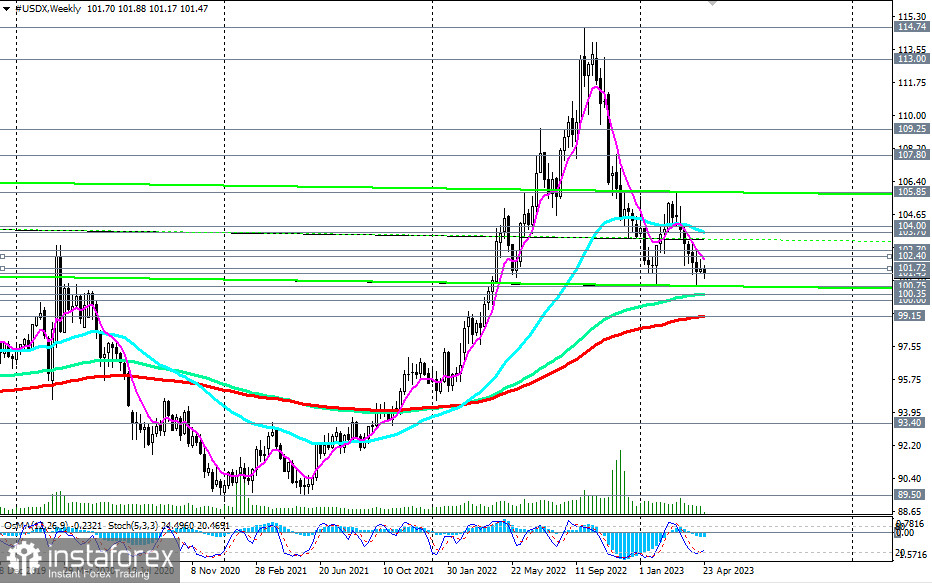
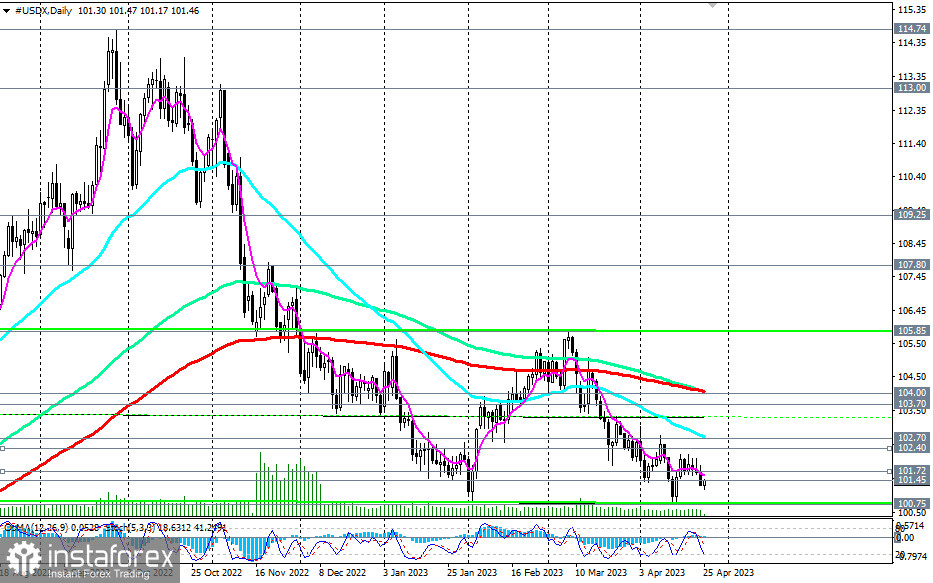
The prospects for the dollar are deteriorating, as evidenced by the nearly uninterrupted 7-month decline of its DXY index (CFD #USDX in the MT4 terminal). Currently, it is trading in the area of short-term and medium-term markets, falling towards the key support levels of 100.35 (144 EMA on the weekly chart), 100.00, and 99.15 (200 EMA on the weekly chart).
A breakdown of the psychologically significant support level of 100.00 may trigger a further decline in the DXY, while breaking the support level of 99.15 would significantly increase the risk of breaking the dollar's long-term bullish trend, which still remains in the global bull market area, above the support level of 93.40 (200 EMA on the monthly chart).
In an alternative scenario, the DXY will resume growth. This may happen either by bouncing off support levels 100.35, 100.00, or from current levels. However, to resume long positions, it is better to wait for the DXY to rise above the resistance levels of 102.40 (200 EMA on the 4-hour chart) and 102.70 (50 EMA on the daily chart).
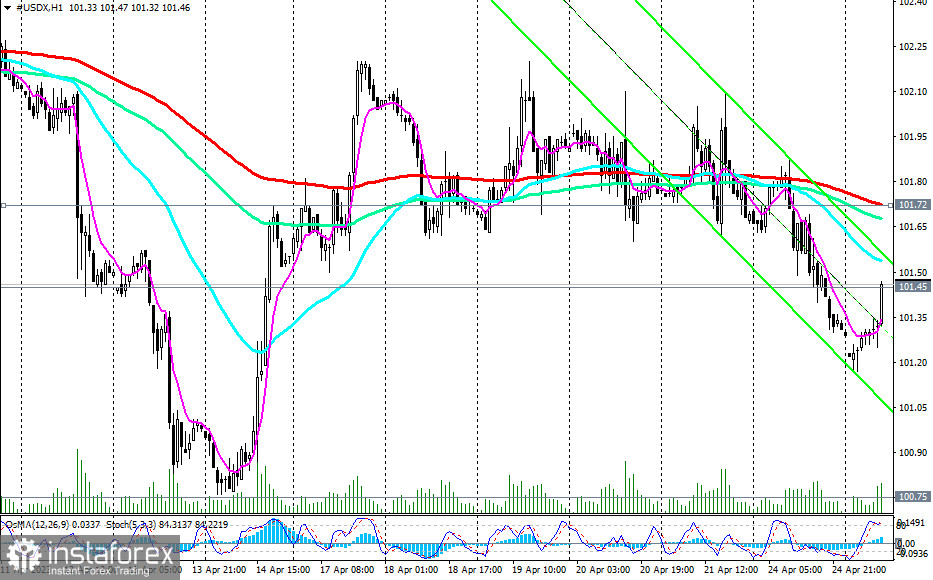
The very first signal for buying may be a breakout of the short-term resistance level 101.72 (200 EMA on the 1-hour chart). But only a breakout of the 104.00 resistance level (200 EMA on the daily chart) will bring the DXY back into the medium-term bull market zone, also resuming its long-term dynamics.
For now, the downward dynamics of the DXY prevail, based on which preference should be given to short positions.
Support levels: 101.00, 100.75, 100.35, 100.00, 99.15, 99.00, 93.40
Resistance levels: 101.45, 101.72, 102.00, 102.40, 102.70, 103.00, 103.70, 104.00, 105.00, 105.85, 107.00, 107.80, 109.25
*The market analysis posted here is meant to increase your awareness, but not to give instructions to make a trade.
InstaSpot analytical reviews will make you fully aware of market trends! Being an InstaSpot client, you are provided with a large number of free services for efficient trading.


