


La leggenda nel team InstaSpot!!
Legenda! Pensi che sia troppo patetico? Ma come dobbiamo chiamare un uomo, che è diventato il primo dell'Asia a vincere il campionato mondiale di scacchi a 18 anni e che è diventato il primo Gran Maestro indiano a 19? Fu l'inizio di un duro cammino verso il titolo di campione del mondo, l'uomo che divenne per sempre una parte della storia di scacchi. Un'altra leggenda nel team InstaSpot!


Il Borussia è una delle squadre di calcio più titolate in Germania, che ha ripetutamente dimostrato ai tifosi che lo spirito di competizione e leadership porta al successo. Fai trading nello stesso modo in cui lo fanno i professionisti dello sport - fiduciosamente e attivamente. Segui il Borussia FC e sii avanti con InstaSpot!

Market participants are assessing the macroeconomic data coming from the U.S., trying to predict both the likelihood of a recession in the American economy and the actions of the Federal Reserve under current conditions.
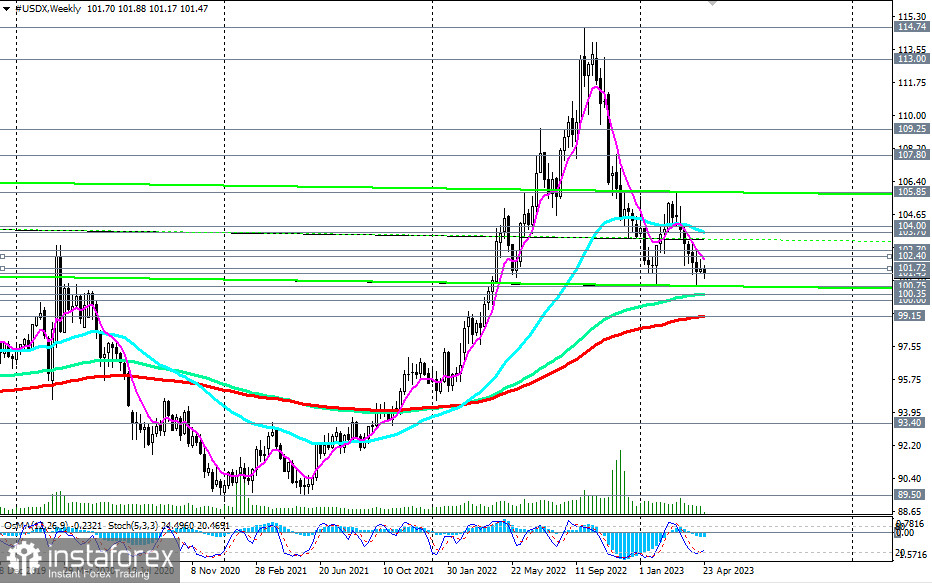
The prospects for the dollar are deteriorating, as evidenced by the nearly uninterrupted 7-month decline of its DXY index (CFD #USDX in the MT4 terminal). Currently, it is trading in the area of short-term and medium-term markets, falling towards the key support levels of 100.35 (144 EMA on the weekly chart), 100.00, and 99.15 (200 EMA on the weekly chart).
A breakdown of the psychologically significant support level of 100.00 may trigger a further decline in the DXY, while breaking the support level of 99.15 would significantly increase the risk of breaking the dollar's long-term bullish trend, which still remains in the global bull market area, above the support level of 93.40 (200 EMA on the monthly chart).
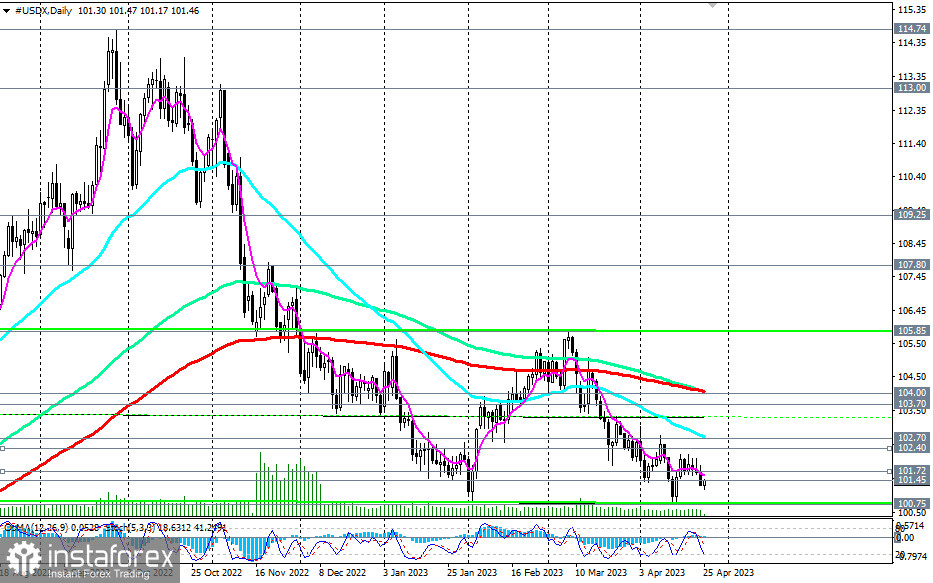
In an alternative scenario, the DXY will resume growth. This may happen either by bouncing off support levels 100.35, 100.00, or from current levels. However, to resume long positions, it is better to wait for the DXY to rise above the resistance levels of 102.40 (200 EMA on the 4-hour chart) and 102.70 (50 EMA on the daily chart).
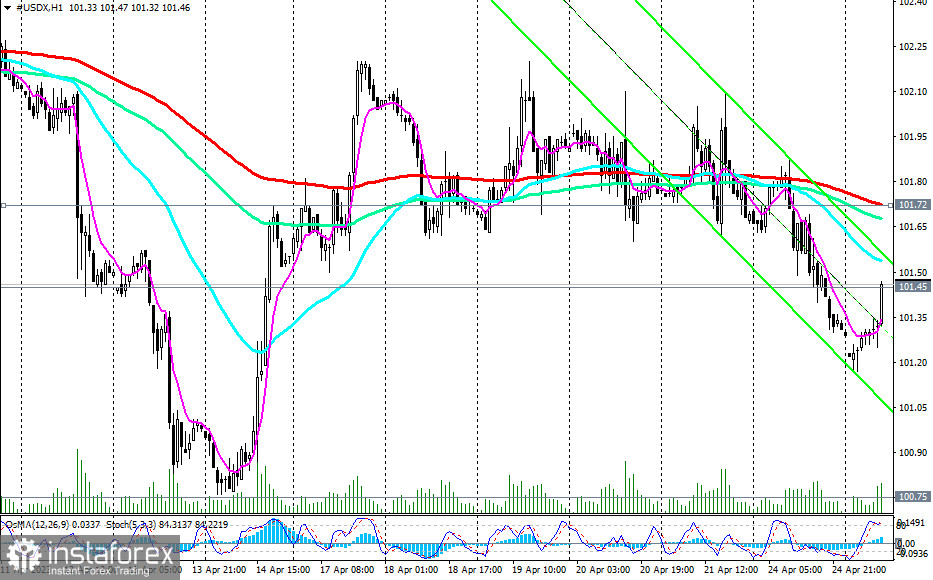
The very first signal for buying may be a breakout of the short-term resistance level 101.72 (200 EMA on the 1-hour chart). But only a breakout of the 104.00 resistance level (200 EMA on the daily chart) will bring the DXY back into the medium-term bull market zone, also resuming its long-term dynamics.
For now, the downward dynamics of the DXY prevail, based on which preference should be given to short positions.
Support levels: 101.00, 100.75, 100.35, 100.00, 99.15, 99.00, 93.40
Resistance levels: 101.45, 101.72, 102.00, 102.40, 102.70, 103.00, 103.70, 104.00, 105.00, 105.85, 107.00, 107.80, 109.25
*La presente analisi del mercato ha un carattere esclusivamente informativo e non rappresenta una guida per l`effettuazione di una transazione.
Le recensioni analitiche di InstaSpot ti renderanno pienamente consapevole delle tendenze del mercato! Essendo un cliente InstaSpot, ti viene fornito un gran numero di servizi gratuiti per il trading efficiente.


