


Huyền thoại trong nhóm InstaSpot!
Huyền thoại! Bạn nghĩ rằng đó là lời nói khoa trương? Nhưng chúng ta nên gọi một người đàn ông như thế nào, người đã trở thành người châu Á đầu tiên giành chức vô địch cờ vua thế giới lứa tuổi thiếu niên năm 18 tuổi và người trở thành Đại kiện tướng Ấn Độ đầu tiên năm 19 tuổi? Đó là khởi đầu cho con đường khó khăn đến danh hiệu Vô địch Thế giới của Viswanathan Anand, người đàn ông đã trở thành một phần của lịch sử cờ vua mãi mãi. Giờ đây, một huyền thoại nữa trong nhóm InstaSpot!


Borussia là một trong những câu lạc bộ bóng đá danh giá nhất nước Đức, đã nhiều lần chứng minh cho người hâm mộ thấy: tinh thần thi đấu và sự lãnh đạo chắc chắn sẽ dẫn đến thành công. Giao dịch theo cách mà các chuyên gia thể thao chơi trò chơi: tự tin và chủ động. Giữ một "đường chuyền" từ Borussia FC và dẫn đầu với InstaSpot!
Market participants are assessing the macroeconomic data coming from the U.S., trying to predict both the likelihood of a recession in the American economy and the actions of the Federal Reserve under current conditions.
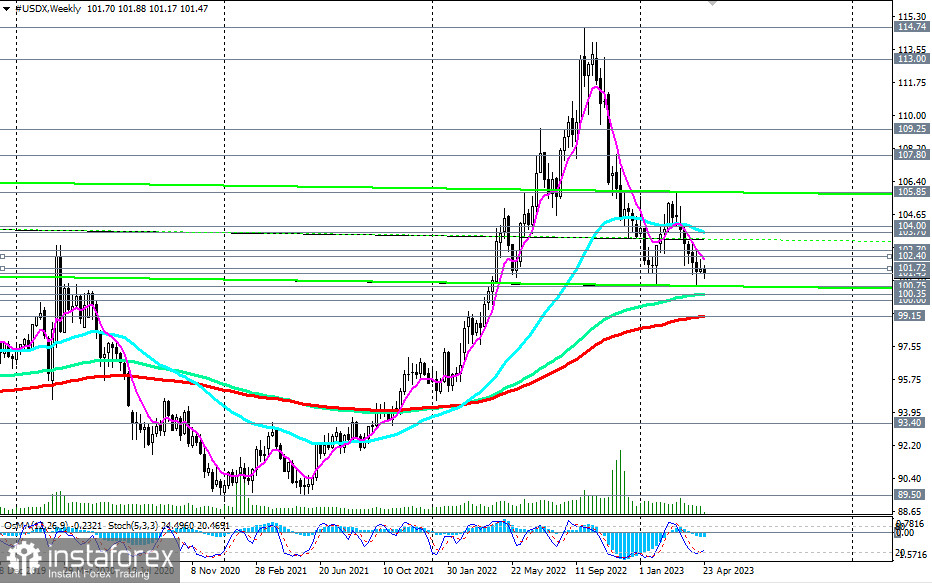
The prospects for the dollar are deteriorating, as evidenced by the nearly uninterrupted 7-month decline of its DXY index (CFD #USDX in the MT4 terminal). Currently, it is trading in the area of short-term and medium-term markets, falling towards the key support levels of 100.35 (144 EMA on the weekly chart), 100.00, and 99.15 (200 EMA on the weekly chart).
A breakdown of the psychologically significant support level of 100.00 may trigger a further decline in the DXY, while breaking the support level of 99.15 would significantly increase the risk of breaking the dollar's long-term bullish trend, which still remains in the global bull market area, above the support level of 93.40 (200 EMA on the monthly chart).
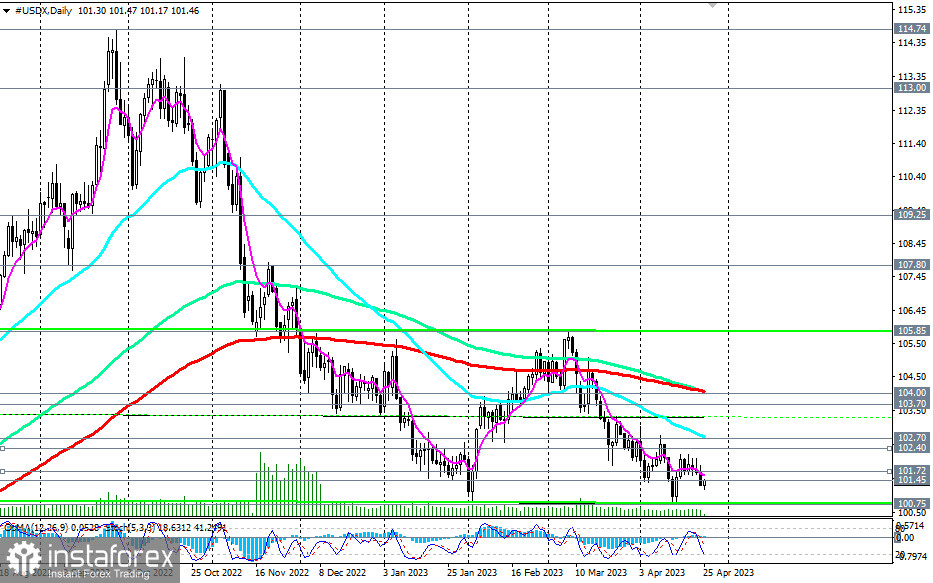
In an alternative scenario, the DXY will resume growth. This may happen either by bouncing off support levels 100.35, 100.00, or from current levels. However, to resume long positions, it is better to wait for the DXY to rise above the resistance levels of 102.40 (200 EMA on the 4-hour chart) and 102.70 (50 EMA on the daily chart).
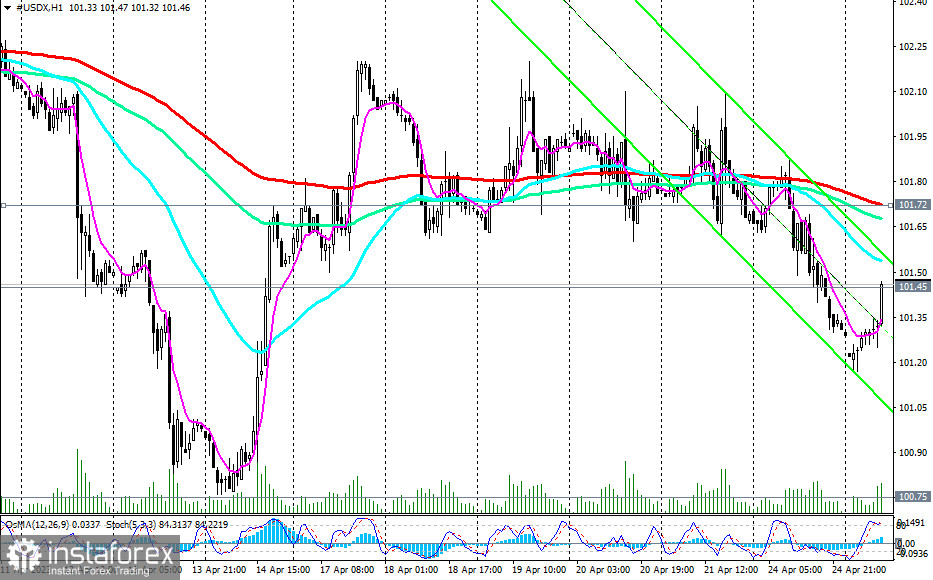
The very first signal for buying may be a breakout of the short-term resistance level 101.72 (200 EMA on the 1-hour chart). But only a breakout of the 104.00 resistance level (200 EMA on the daily chart) will bring the DXY back into the medium-term bull market zone, also resuming its long-term dynamics.
For now, the downward dynamics of the DXY prevail, based on which preference should be given to short positions.
Support levels: 101.00, 100.75, 100.35, 100.00, 99.15, 99.00, 93.40
Resistance levels: 101.45, 101.72, 102.00, 102.40, 102.70, 103.00, 103.70, 104.00, 105.00, 105.85, 107.00, 107.80, 109.25
*Phân tích thị trường được đăng tải ở đây có nghĩa là để gia tăng nhận thức của bạn, nhưng không đưa ra các chỉ dẫn để thực hiện một giao dịch.
InstaSpot analytical reviews will make you fully aware of market trends! Being an InstaSpot client, you are provided with a large number of free services for efficient trading.


