




Our team has over 7,000,000 traders!
Every day we work together to improve trading. We get high results and move forward.
Recognition by millions of traders all over the world is the best appreciation of our work! You made your choice and we will do everything it takes to meet your expectations!
We are a great team together!
InstaSpot. Proud to work for you!





Actor, UFC 6 tournament champion and a true hero!
The man who made himself. The man that goes our way.
The secret behind Taktarov's success is constant movement towards the goal.
Reveal all the sides of your talent!
Discover, try, fail - but never stop!
InstaSpot. Your success story starts here!

Bitcoin and Ethereum posted a rapid rally that has already clearly faded. The Treasury's decision to increase bond buybacks sparked a crypto-market surge, but we continue to ask how long it can last when supported by a single factor. In essence, it was a "black swan" that arrived at an unexpected moment. Despite strong gains in both cryptocurrencies, we do not believe the downtrend is over. The fundamental backdrop remains weak for the crypto segment; downtrends are not broken for either Ethereum or Bitcoin. We still see no grounds for a sustained rally. Sentiment in the crypto space has become much more optimistic, but we warn traders: this may be a pump or manipulation.
Meanwhile, Bitwise reported that the correlation between Bitcoin and gold has reached its highest level since 2020. We should note this is a 90?day correlation. A company analyst said that in current circumstances this correlation "can work." Bitwise's head of research, Andre Dragosh, also said that Bitcoin is gradually beginning to show characteristics of a defensive asset.
Let's examine these ideas in more detail. Start with the fact that even if you take two completely unrelated instruments, you can always find stretches on their charts where they move similarly. Does that mean there is a correlation between the Japanese yen and Solana? Hardly. Correlation is only a long?term relationship between assets. For example, the euro and the pound sterling have a high correlation that has existed for decades. There is no correlation between Bitcoin and gold because they are fundamentally different assets. As for a "90?day correlation," it's another attempt by so?called experts to present wishful thinking as reality. Again, just wait until two selected instruments trade in the same direction, announce a correlation, and base wild forecasts on it. An instrument either correlates consistently with another, or it does not.
We have heard claims about Bitcoin's safe?haven status before. Similar statements were made in the last decade and now sound like "Please buy Bitcoin." Remember that many experts have a personal stake in Bitcoin's rise because they hold large investments in it. They thus need new capital inflows to lift the value of their holdings. The dollar has safe?haven status, as the war in Iran well demonstrated. The Swiss franc or gold are safe havens. Bitcoin is not.
Why the "Texas sharpshooter"? There's a tale about an American farmer who practiced shooting at the wall of his barn. He shot for a long time. Some spots on the wall received more hits, others fewer. After a while, he simply drew circles around the clusters of hits, turning random patterns into "targets."
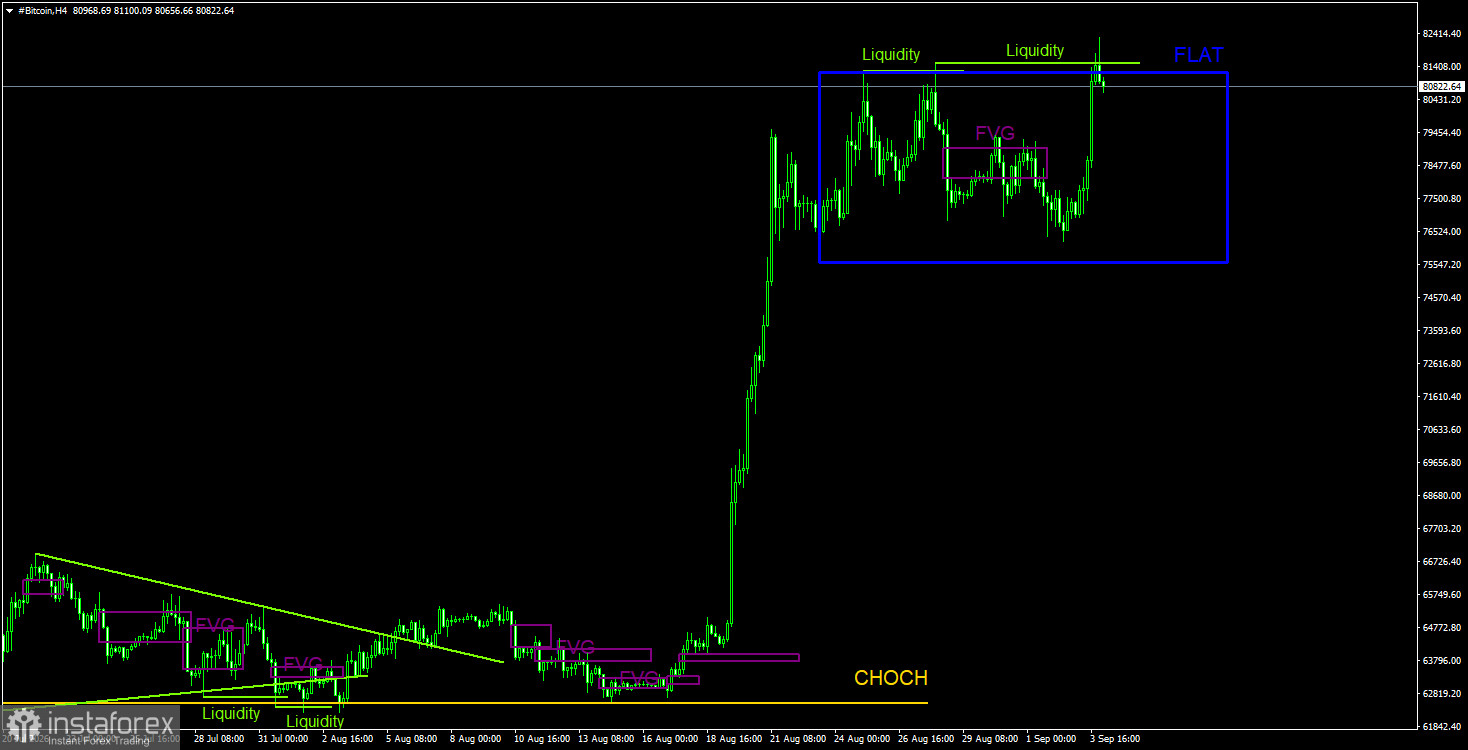
Bitcoin continues to form a downtrend despite the strong rally a week earlier. We still expect a decline toward $57,500 (the 61.8% Fibonacci level of the three?year uptrend), although this level has essentially already been addressed. We do not believe the downtrend is over. The current rally in the primary cryptocurrency looks little like a corrective bounce and is not a compelling reason to open longs. The move resembles a pump. Liquidity could be taken from the $82,850 high, which may trigger a new leg down. On the 4?hour timeframe, another decline is also possible after a second liquidity sweep from the most recent local top.
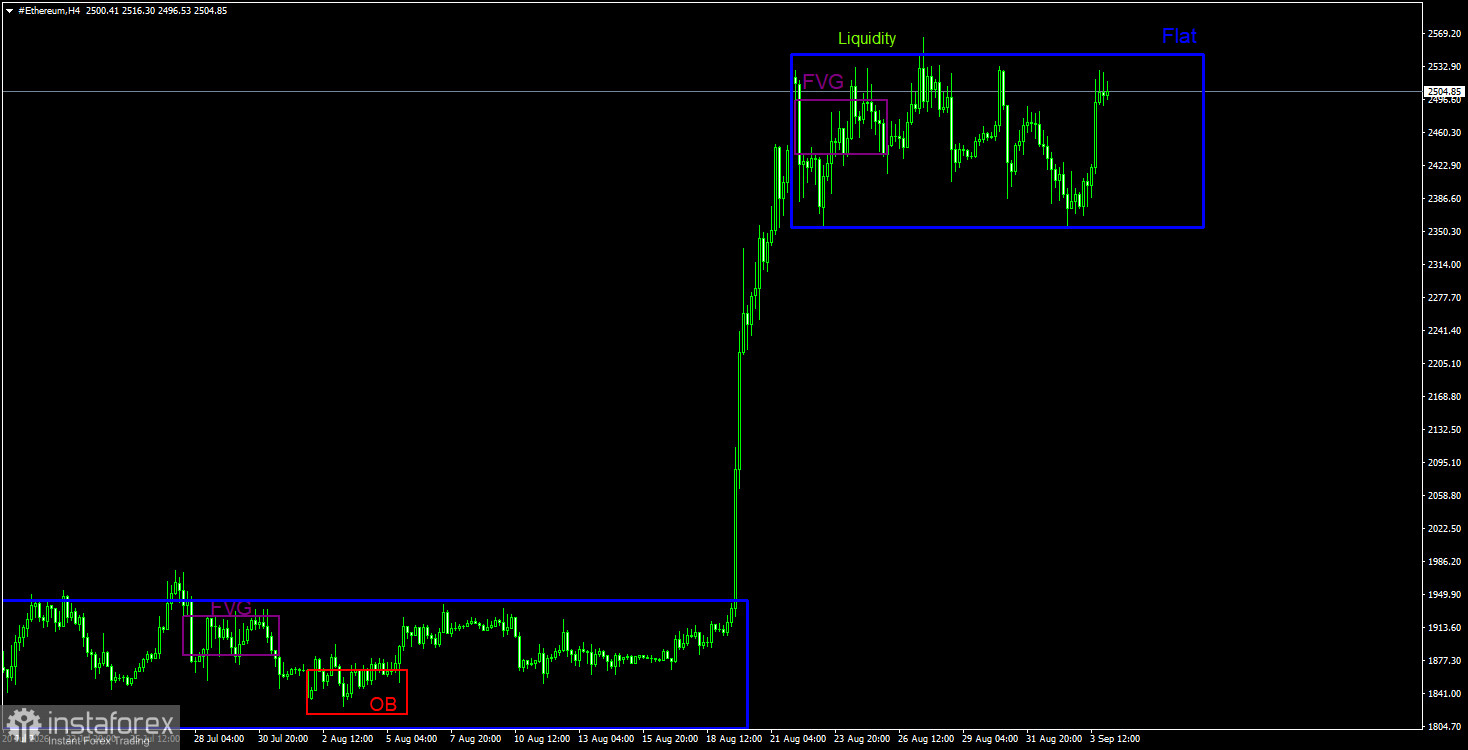
On the daily timeframe, the technical picture changed completely in just a few days. Ethereum may now be able to start a new uptrend. However, traders should look to the weekly chart, on which Ethereum could head toward $4,800 — the upper band of a five?year sideways channel. On the daily chart, the nearest bearish fair value gap (FVG) has been filled, but that FVG belongs to the prior trend; if it provokes a market reaction, it will most likely be corrective. Also note the liquidity taken from the April 17 high and the liquidity sweep on the 4?hour timeframe. Bitcoin also had liquidity taken on the 4?hour chart. Therefore, at least a correction should occur, but on Ethereum's 4?hour chart a flat range has already formed. Inside a flat, internal patterns carry little weight, and in the near term one should expect only a drop toward the flat's lower band.
Comments on the charts
CHOCH is a change of character / break of the trend structure. Liquidity means traders' Stop?Losses that market?makers use to build their positions. FVG is Fair Value Gap (area of price inefficiency). The price often moves quickly through such areas, indicating the absence of one side in the market. Later, the price tends to return and react to these zones. IFVG stands for Inverted Fair Value Gap. After a return to such a zone, the price does not react but impulsively breaks through and then tests it from the other side.
OB means Order Block. A candle on which a market?maker opened a position in order to harvest liquidity and then form their own position in the opposite direction.
*এখানে পোস্ট করা মার্কেট বিশ্লেষণ আপনার সচেতনতা বৃদ্ধির জন্য প্রদান করা হয়, ট্রেড করার নির্দেশনা প্রদানের জন্য প্রদান করা হয় না।
ইন্সটাফরেক্স বিশ্লেষণমূলক পর্যালোচনাগুলো আপনাকে মার্কেট প্রবণতা সম্পর্কে পুরোপুরি সচেতন করবে! ইন্সটাফরেক্সের একজন গ্রাহক হওয়ায়, দক্ষ ট্রেডিং এর জন্য আপনাকে অনেক সেবা বিনামূল্যে প্রদান করা হয়।


