



¡La leyenda en el equipo de InstaSpot!
¡Leyenda! ¿Cree que es una retórica grandilocuente? Pero, ¿cómo deberíamos llamar a un hombre, que se convirtió en el primer asiático en ganar el campeonato mundial de ajedrez júnior a los 18 años y en el primer Gran Maestro indio a los 19 años? Ese fue el comienzo de un camino difícil hacia el título de Campeón del Mundo para Viswanathan Anand, el hombre que se convirtió en parte de la historia del ajedrez para siempre. ¡Ahora una leyenda más en el equipo de InstaSpot!



Borussia es uno de los clubes de fútbol con más títulos en Alemania, que ha demostrado repetidamente a los fanáticos: el espíritu de competencia y liderazgo que ciertamente conducirán al éxito. Opere de la misma manera que los profesionales del deporte: con confianza y de forma activa. ¡Mantenga un "pase" del Borussia FC y lidere con InstaSpot!
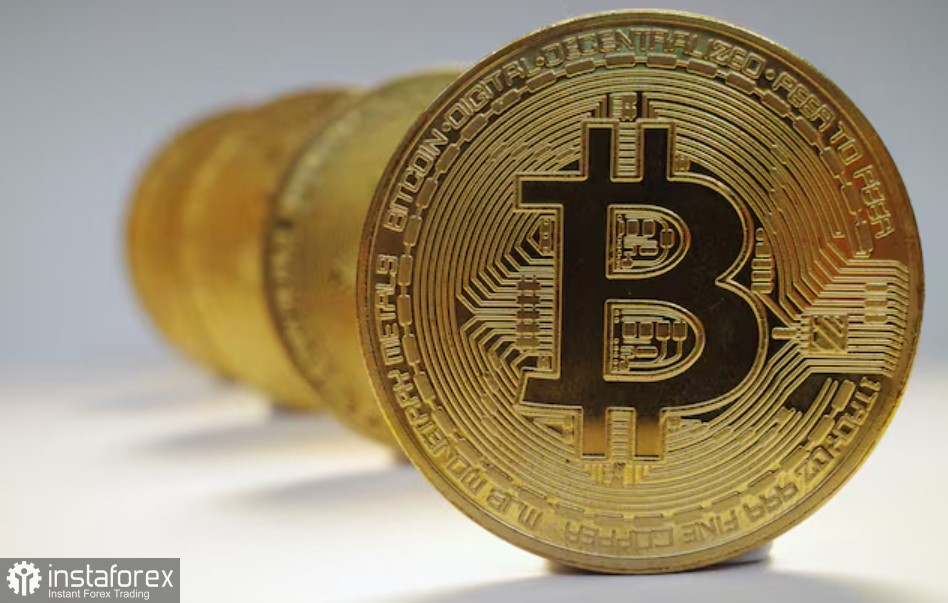
Bitcoin has slipped below $83,000 and is currently trading around $82,300, roughly 1.5% lower than 24 hours ago. Market conditions remain unfavorable for risk assets: US yields, oil, and the dollar are all rising.
All three pressure points are linked. Oil jumped by more than 4% in a day, with WTI rising to $92.40 per barrel and Brent climbing to $105. Expensive energy revives inflation fears, and the minutes from the September Fed meeting already showed most participants view another rate hike by year-end as likely. As a result, the 10-year US Treasury yield climbed to 5.352%, while 30-year yields are renewing highs above 5.73%. That combination benefits dollar holders and high-yield bond investors and hurts non-yielding assets like Bitcoin and Ether.
Bitcoin also faces the technical problem that sellers and profit-takers are increasing disproportionately to demand at these levels, and any breach of a round number — whether $84,000 or $83,000 — automatically feeds extra panic into the market.
My base case: pressure should persist in the coming days, and while the price remains below $83,500, I expect a test of the $82,000 area. Holding that support would leave room for a rebound. A break and consolidation below it would open the way to $80,500. A true reversal signal won't come from crypto news but from a halt in the rise of yields and oil.
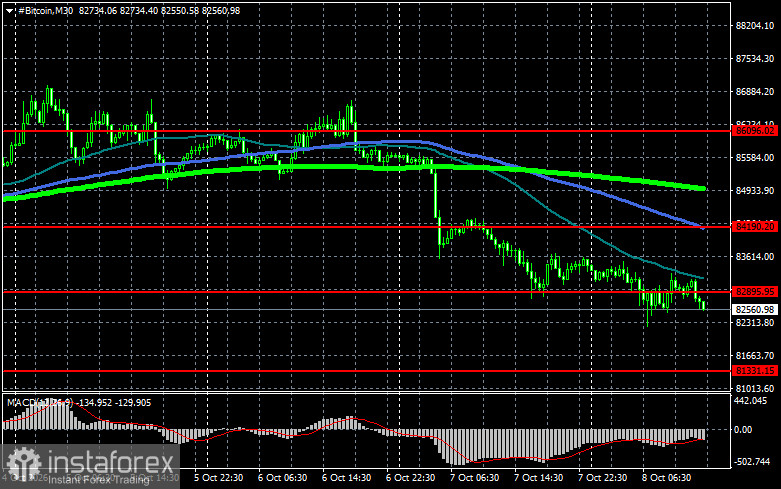
Bitcoin technicals
Buyers are currently targeting a return to $82,900, which would open a direct path to $84,100 and then toward $86,000. A break above $86,000 would signal attempts to restore the bull market. On the downside, I expect buyers to step in near $81,300. A decisive move below that area could quickly push BTC down to around $79,400. A further target on an extended drawdown would be the $78,100 area.
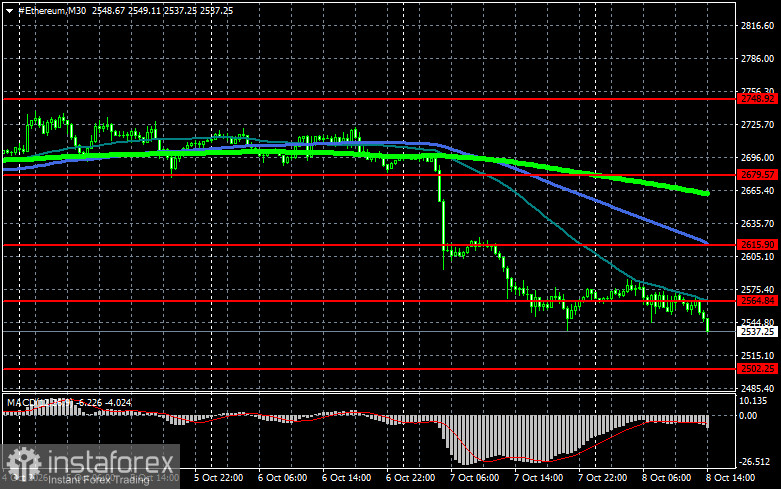
Ethereum technicals
A clear consolidation above $2,564 would open a straight path to $2,615. The further upside target is the $2,679 high. Overcoming that would confirm strengthening bullish sentiment and return buyers' interest. On the downside, I expect buyers near $2,502. A break and consolidation below that level could rapidly drive ETH toward $2,448. A deeper target in an extended sell-off would be around $2,385.
What's on the chart:
Crosses of — or tests by the price of — these moving averages typically either halt moves or set the next market impulse.
*El análisis de mercado publicado aquí tiene la finalidad de incrementar su conocimiento, más no darle instrucciones para realizar una operación.
¡Los informes analíticos de InstaSpot lo mantendrá bien informado de las tendencias del mercado! Al ser un cliente de InstaSpot, se le proporciona una gran cantidad de servicios gratuitos para una operación eficiente.


