



ہمارے ٹیم میں 7000000 سے ذائد تاجران شامل ہیں
ہم تجارت کی بہتری کے لئے ہر روز اکھٹے کام کرتے ہیں اور بہترین نتائج حاصل کرتے ہوئے آگے کی جانب بڑھتے ہیں
دُنیا بھر سے سے لاکھوں ہمارے بہترین کام کو سند عطاء کرتے ہیں آپ اپنا انتحاب کریں باقی ہم آپ کی توقعات پر پورا اترنے کے لئے اپنی بہترین کوشش کریں گے
ہم مل کر ایک بہترین ٹیم بناتے ہیں
انسٹا فاریکس آپ سے کام کرتے ہوئے فخر محسوس کرتا ہے



ایکٹر - یو سی ایف 6 ٹورنامنٹ چیمپین اور واقعی ہیرو
ایک فرد کے جس نے اپنا آپ منوایا ہے وہ فرد کہ جو ہماری راہ پر چلا ہے.
ٹکٹا روو کی کامیابی کا راز یہ ہے کہ وہ اپنے اہداف کی جانب مسلسل بڑھتا رہتا ہے
اپنے ہنر یا ٹیلنٹ کے تمام پہلو آشکار کررہے ہیں
پہچانیں ، کوشش کریں ، ناکام ہوں لیکن کبھی نہ رُکیں
انسٹا فاریکس آپ کی کامیابی کی کہاں یہاں سے شروع ہوتی ہے

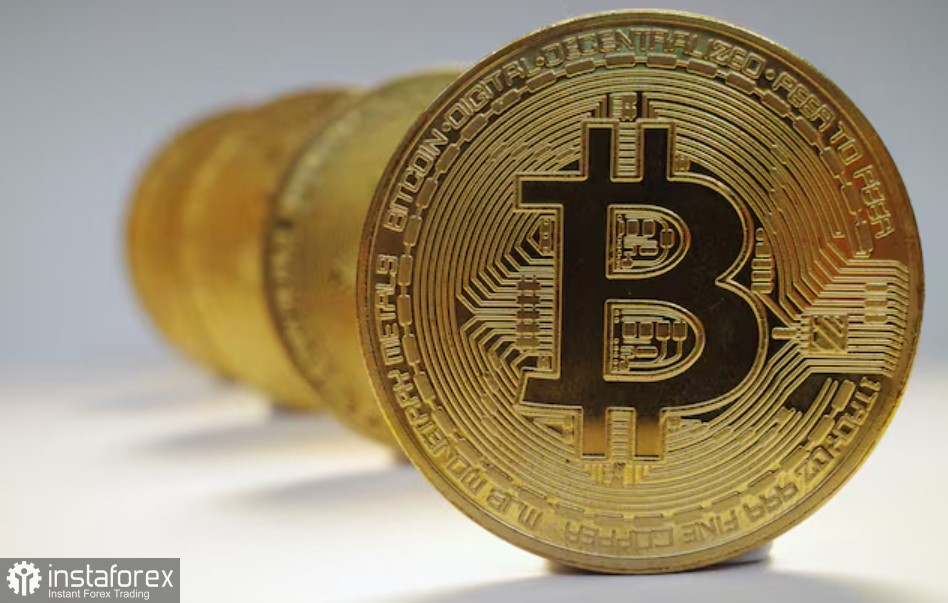
Bitcoin has slipped below $83,000 and is currently trading around $82,300, roughly 1.5% lower than 24 hours ago. Market conditions remain unfavorable for risk assets: US yields, oil, and the dollar are all rising.
All three pressure points are linked. Oil jumped by more than 4% in a day, with WTI rising to $92.40 per barrel and Brent climbing to $105. Expensive energy revives inflation fears, and the minutes from the September Fed meeting already showed most participants view another rate hike by year-end as likely. As a result, the 10-year US Treasury yield climbed to 5.352%, while 30-year yields are renewing highs above 5.73%. That combination benefits dollar holders and high-yield bond investors and hurts non-yielding assets like Bitcoin and Ether.
Bitcoin also faces the technical problem that sellers and profit-takers are increasing disproportionately to demand at these levels, and any breach of a round number — whether $84,000 or $83,000 — automatically feeds extra panic into the market.
My base case: pressure should persist in the coming days, and while the price remains below $83,500, I expect a test of the $82,000 area. Holding that support would leave room for a rebound. A break and consolidation below it would open the way to $80,500. A true reversal signal won't come from crypto news but from a halt in the rise of yields and oil.
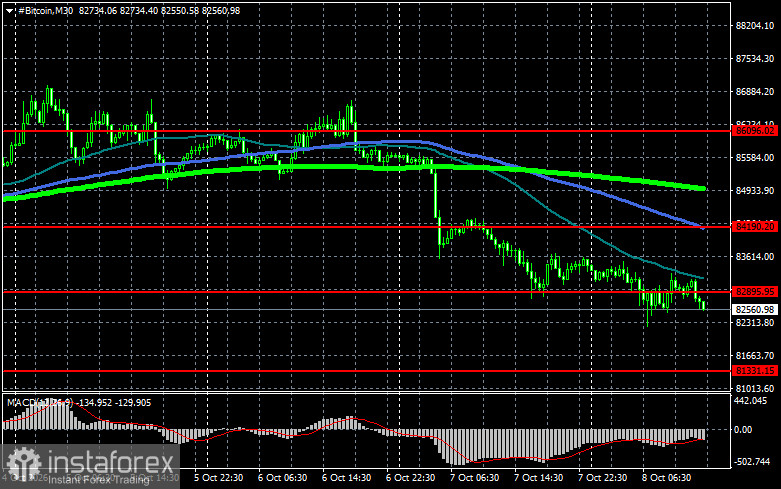
Bitcoin technicals
Buyers are currently targeting a return to $82,900, which would open a direct path to $84,100 and then toward $86,000. A break above $86,000 would signal attempts to restore the bull market. On the downside, I expect buyers to step in near $81,300. A decisive move below that area could quickly push BTC down to around $79,400. A further target on an extended drawdown would be the $78,100 area.
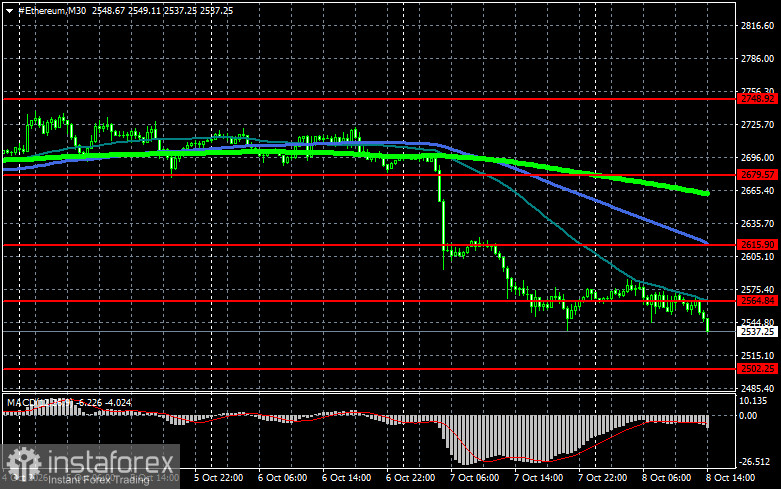
Ethereum technicals
A clear consolidation above $2,564 would open a straight path to $2,615. The further upside target is the $2,679 high. Overcoming that would confirm strengthening bullish sentiment and return buyers' interest. On the downside, I expect buyers near $2,502. A break and consolidation below that level could rapidly drive ETH toward $2,448. A deeper target in an extended sell-off would be around $2,385.
What's on the chart:
Crosses of — or tests by the price of — these moving averages typically either halt moves or set the next market impulse.
*تعینات کیا مراد ہے مارکیٹ کے تجزیات یہاں ارسال کیے جاتے ہیں جس کا مقصد آپ کی بیداری بڑھانا ہے، لیکن تجارت کرنے کے لئے ہدایات دینا نہیں.
InstaSpot analytical reviews will make you fully aware of market trends! Being an InstaSpot client, you are provided with a large number of free services for efficient trading.


