


¡Nuestro equipo cuenta con más de 7,000,000 operadores!
Cada día, trabajamos juntos para mejorar las operaciones. Obtenemos grandes resultados y seguimos adelante.
El reconocimiento de millones de operadores en todo el mundo es el mejor agradecimiento a nuestro trabajo! ¡Usted hizo su elección y haremos todo lo que esté a nuestro alcance para satisfacer sus expectativas!
¡Juntos somos un gran equipo!
InstaSpot. ¡Orgulloso de trabajar para usted!


¡Actor, 6 veces ganador del torneo UFC y un verdadero héroe!
El hombre que se hizo a sí mismo. El hombre que sigue nuestro camino.
El secreto detrás del éxito de Taktarov es el constante movimiento hacia el objetivo.
¡Revele todo los lados de su talento!
Descubra, intente, fracase, ¡pero nunca se rinda!
InstaSpot. ¡Su historia de éxito comienza aquí!
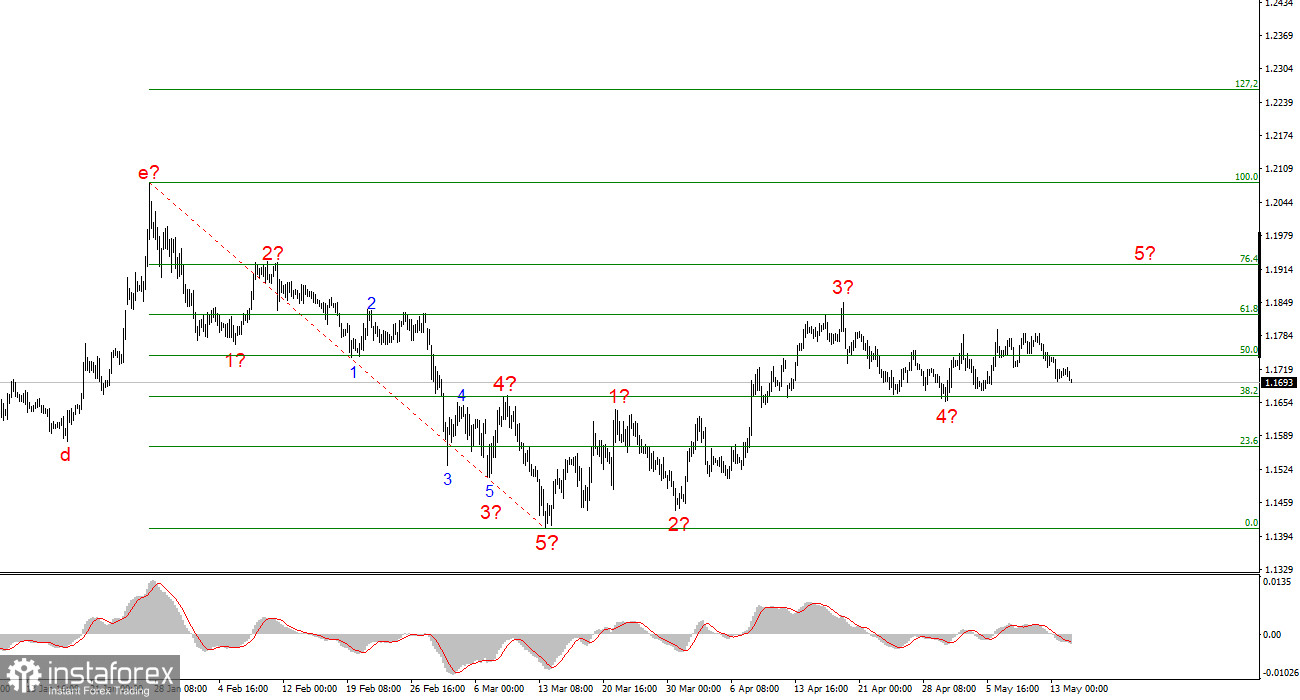
The wave pattern on the 4-hour EUR/USD chart has changed. There is still no talk of canceling the upward trend section (lower chart), which began in January last year. However, the current wave structure now appears highly ambiguous. In such situations, I always recommend switching to a lower timeframe (upper chart) and focusing on the simplest and smallest wave structures in order to make short-term forecasts, which are sufficient for opening trades. Wave structures can be very complex and may involve multiple scenarios. The simplest approach is to trade standard "five-three" patterns.
On the chart above, I can identify a classic five-wave impulse structure with an extension in wave three. After this structure was completed, a corrective sequence of at least three waves began forming. However, this structure may still develop into an impulsive five-wave form, which is entirely possible. Nevertheless, we cannot be confident that wave five is forming, as a corrective structure is still expected. In classical terms, it should take a three-wave form. If that is indeed the case, then a new downward trend leg began on April 17.
The euro continues to decline due to U.S. inflation.
The EUR/USD pair fell by 15 basis points on Thursday and has lost 100 points this week overall. This is not particularly significant, and the instrument's daily volatility remains relatively low. Rather, the market continues cautious selling while remaining ready to return to buying at any moment.
This week, two key factors worked against the euro and in favor of the dollar.
The first was a new geopolitical escalation in the Middle East. Iran and the United States once again failed to agree on the terms of a future deal, and at the beginning of the week exchanged aggressive rhetoric, which, however, did not escalate into actual conflict. Fortunately. Nevertheless, risk-off sentiment increased immediately, leading to strengthening of the U.S. dollar.
The second factor was U.S. inflation. No one had doubts that inflation would rise — not only in the United States but globally. However, April CPI data showed that it is increasing faster than economists expected. Inflation rose to 3.8% year-over-year, forcing both the market and the Federal Reserve to shift expectations toward monetary tightening.
At present, there is no discussion of interest rate hikes. This has been stated by several Federal Reserve officials. Policymakers believe rates should remain unchanged for some time in order to properly assess the inflationary impact of the Middle East conflict and the blockade of the Strait of Hormuz. However, the market itself is beginning to lean toward the possibility of policy tightening before the end of the year, which is also supporting the U.S. dollar.
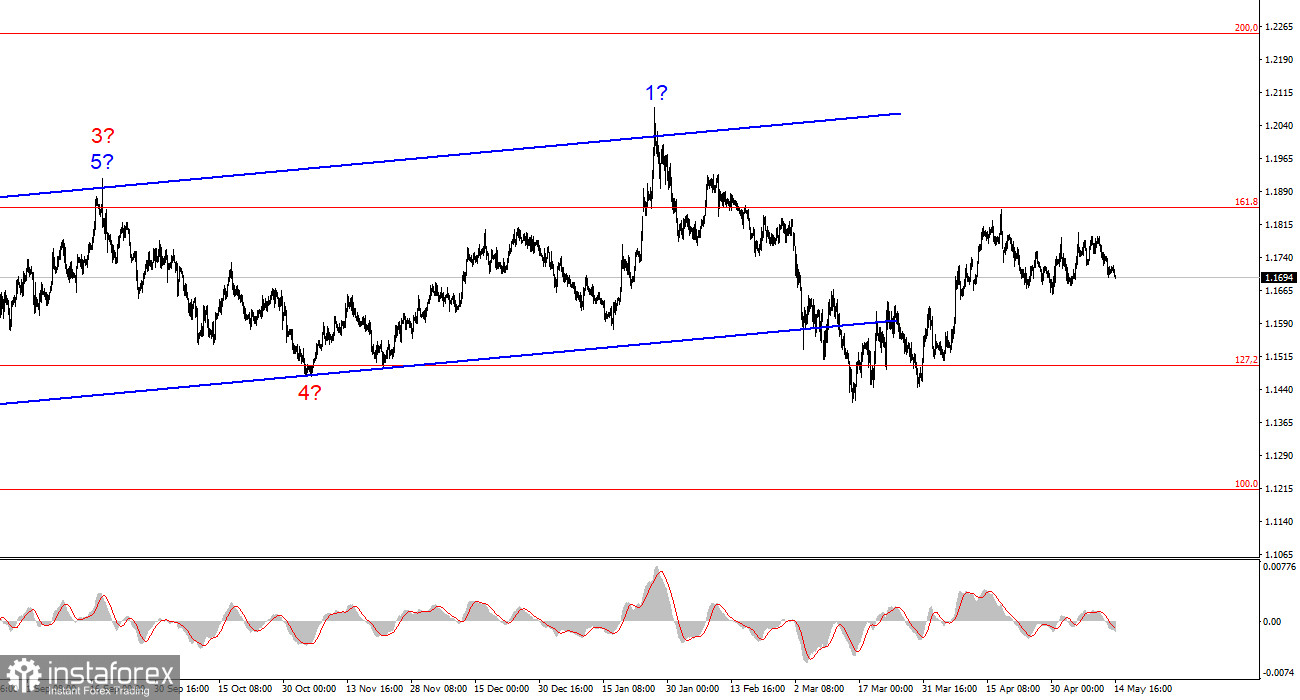
Based on the EUR/USD analysis, I conclude that the instrument remains within an upward trend structure (lower chart), while in the short term it is forming a corrective structure. The corrective wave sequence appears mostly complete but may develop into a more complex and extended formation. However, this would require improvement in the geopolitical situation in the Middle East.
Therefore, without positive news, I expect the instrument to decline below 1.1665, which corresponds to the 38.2% Fibonacci level.
On the lower timeframe, the entire upward trend is visible. The wave structure is not entirely standard, as corrective waves differ in size. For example, the higher-degree wave 2 is smaller than the internal wave 2 within wave 3. However, such situations do occur. It is important to focus on identifiable structures rather than forcing interpretation of every wave.
The latest waves are difficult to classify, which is why I rely on the higher timeframe for analysis.
*El análisis de mercado publicado aquí tiene la finalidad de incrementar su conocimiento, más no darle instrucciones para realizar una operación.
¡Los informes analíticos de InstaSpot lo mantendrá bien informado de las tendencias del mercado! Al ser un cliente de InstaSpot, se le proporciona una gran cantidad de servicios gratuitos para una operación eficiente.


