


¡Nuestro equipo cuenta con más de 7,000,000 operadores!
Cada día, trabajamos juntos para mejorar las operaciones. Obtenemos grandes resultados y seguimos adelante.
El reconocimiento de millones de operadores en todo el mundo es el mejor agradecimiento a nuestro trabajo! ¡Usted hizo su elección y haremos todo lo que esté a nuestro alcance para satisfacer sus expectativas!
¡Juntos somos un gran equipo!
InstaSpot. ¡Orgulloso de trabajar para usted!


¡Actor, 6 veces ganador del torneo UFC y un verdadero héroe!
El hombre que se hizo a sí mismo. El hombre que sigue nuestro camino.
El secreto detrás del éxito de Taktarov es el constante movimiento hacia el objetivo.
¡Revele todo los lados de su talento!
Descubra, intente, fracase, ¡pero nunca se rinda!
InstaSpot. ¡Su historia de éxito comienza aquí!
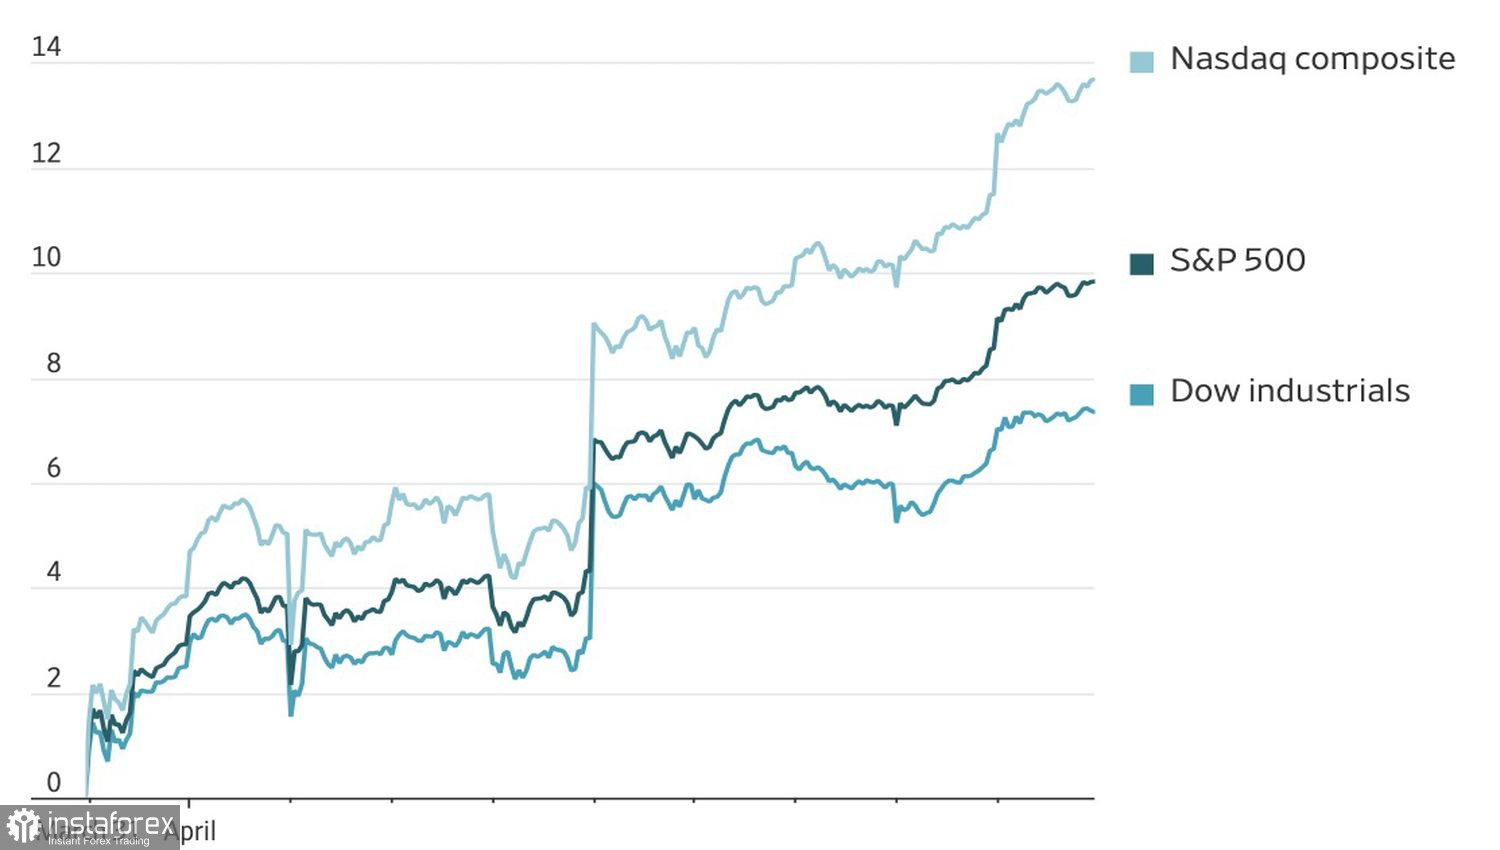
Oil prices have moderated. Banks are reporting blockbuster profits. CEOs are busily selling the strength of the US economy. That combination has powered a 10-day rally in the Nasdaq Composite and a record gain over that span. The S&P 500's advance is more modest — a seven-day rise of about 7%. However, AJ Bell argues this may be only the beginning: over the past 30 years, there have been just three instances where a weekly rally produced gains of 7% or more, and six months later, the broad index averaged a further rise of 19%.
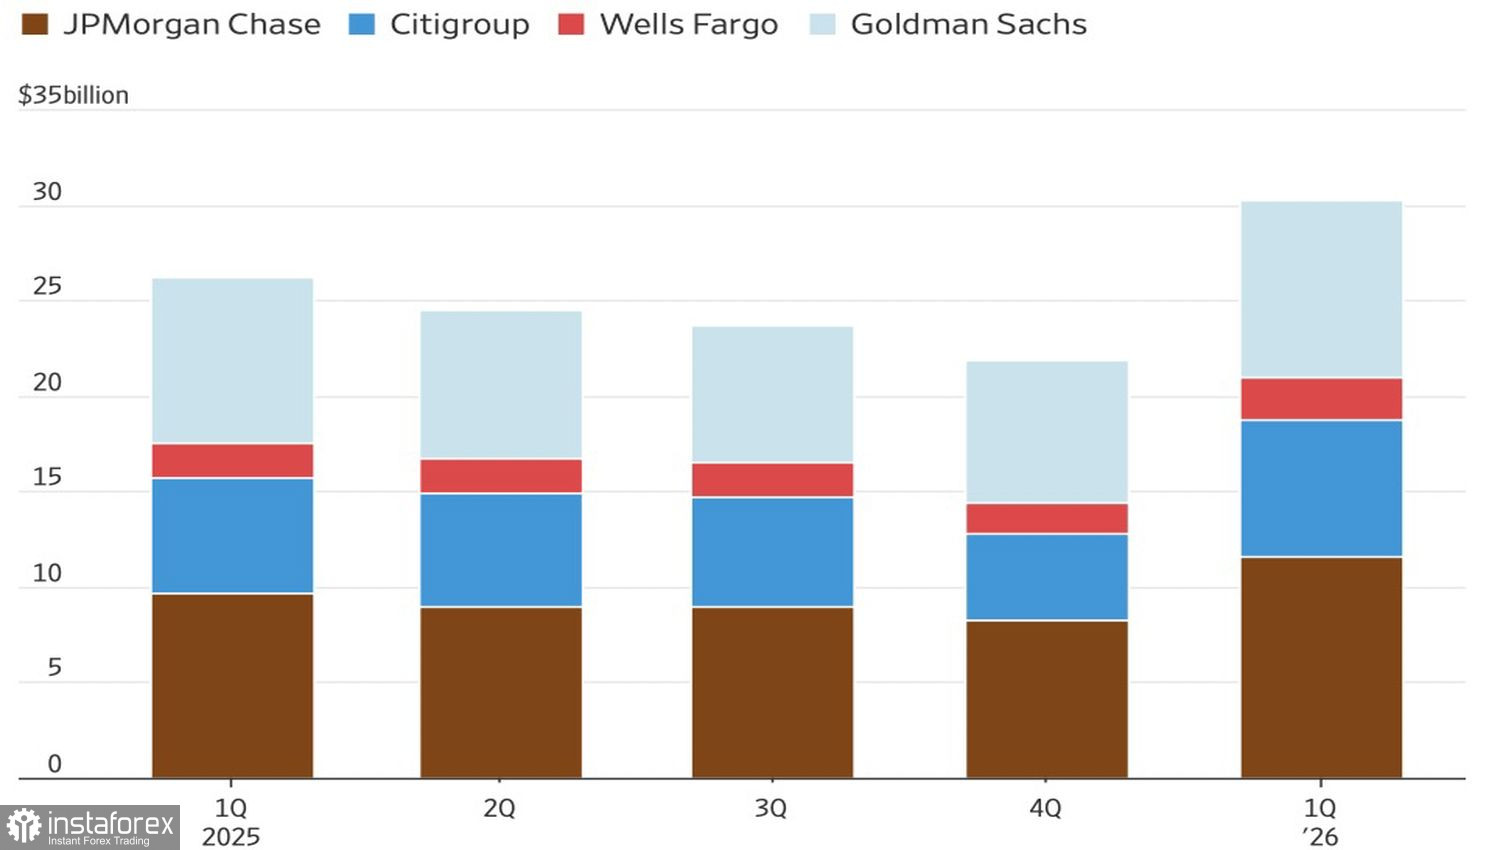
Dynamics and structure of bank revenues
In truth, the rally looks odd. US–Iran talks have collapsed, and the American economy appears weaker than it was before the conflict. US consumer sentiment has fallen to record lows, while one-year inflation expectations have jumped from 3.8% to 4.8% — the highest level since Donald Trump introduced large-scale tariffs on "Liberation Day."
Bank of America notes a clear divergence between macro expectations and equity prices. Its survey finds asset managers and other professionals forecasting slower GDP growth and faster inflation — a stagflationary mix that is typically negative for US equities. Yet equities are rising.
Performance of US equity indices
Is this fatigue with geopolitics? Or a belief that the peak of the Middle East conflict is behind us? It can feel as if sentiment is moving faster than reality. There have been no new agreements, but the S&P 500 is trading as if one has already been struck.
In fact, US strategy appears to be shifting conceptually. Where bombing was once a primary lever, the emphasis now is on economic pressure. Blocking the Strait of Hormuz is intended to cut Iran's oil revenues and constrain funding for its military. That gives both sides stronger incentives to return to the negotiating table. Resumption of dialogue is now a matter of timing.
Supporting the S&P 500 is renewed hope for a federal funds rate cut in 2026 should the Middle East de-escalate. Over the past week, the market-implied probability of monetary easing rose from 14% to 34%. Odds could climb further if Congress confirms Kevin Warsh as Fed chair.
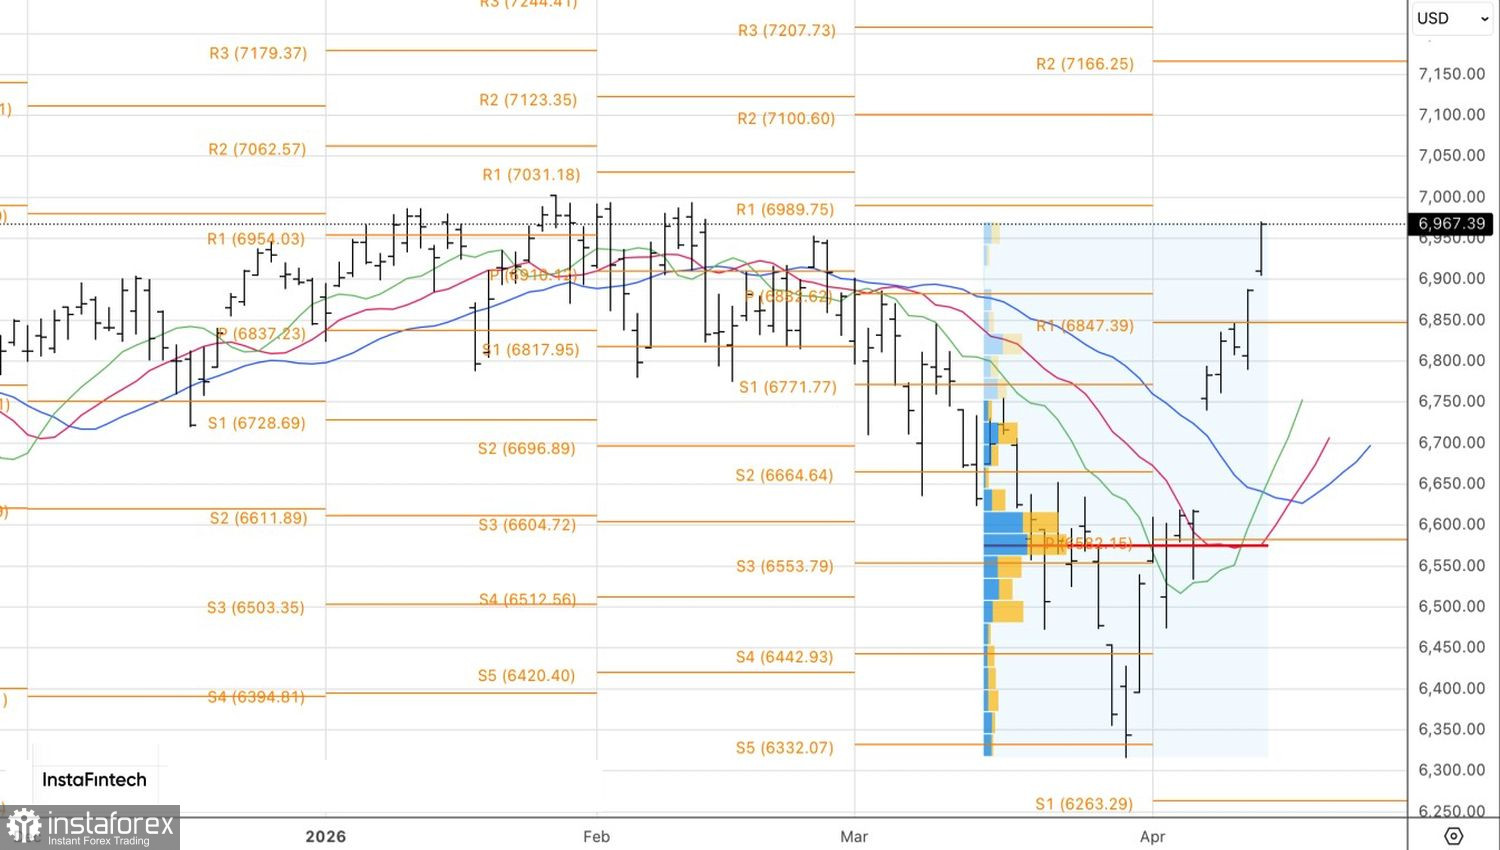
Technically, the daily chart shows that the S&P 500 has already hit both previously set long targets at 6,890 and 6,950. The key support is now the pivot level at 6,905. As long as the broad index remains above that level, the preference should remain for long positions.
*El análisis de mercado publicado aquí tiene la finalidad de incrementar su conocimiento, más no darle instrucciones para realizar una operación.
¡Los informes analíticos de InstaSpot lo mantendrá bien informado de las tendencias del mercado! Al ser un cliente de InstaSpot, se le proporciona una gran cantidad de servicios gratuitos para una operación eficiente.


