


¡Nuestro equipo cuenta con más de 7,000,000 operadores!
Cada día, trabajamos juntos para mejorar las operaciones. Obtenemos grandes resultados y seguimos adelante.
El reconocimiento de millones de operadores en todo el mundo es el mejor agradecimiento a nuestro trabajo! ¡Usted hizo su elección y haremos todo lo que esté a nuestro alcance para satisfacer sus expectativas!
¡Juntos somos un gran equipo!
InstaSpot. ¡Orgulloso de trabajar para usted!


¡Actor, 6 veces ganador del torneo UFC y un verdadero héroe!
El hombre que se hizo a sí mismo. El hombre que sigue nuestro camino.
El secreto detrás del éxito de Taktarov es el constante movimiento hacia el objetivo.
¡Revele todo los lados de su talento!
Descubra, intente, fracase, ¡pero nunca se rinda!
InstaSpot. ¡Su historia de éxito comienza aquí!
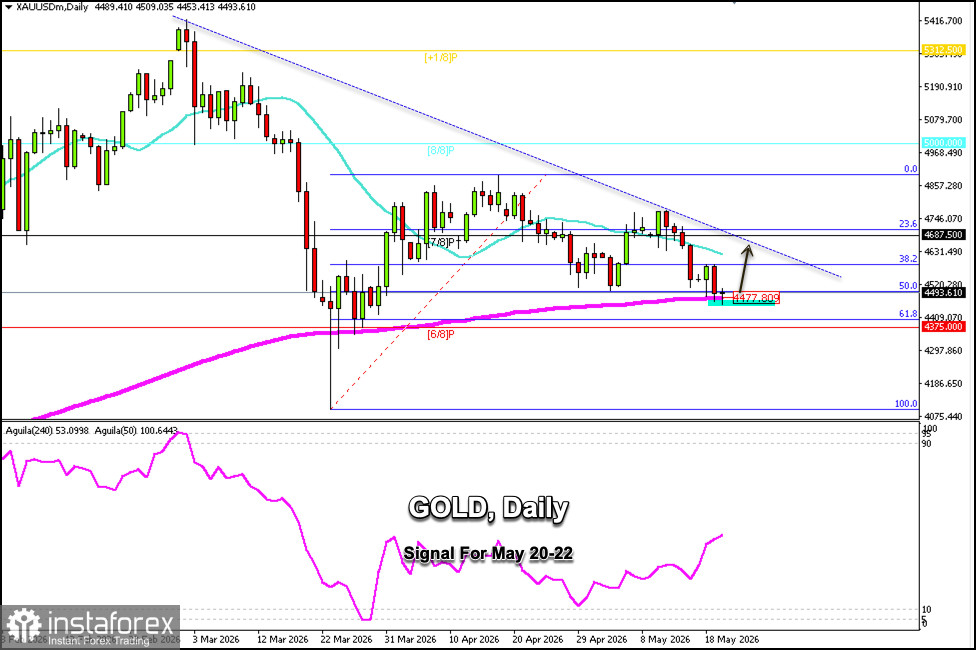
Gold is trading around $4,493, rebounding after reaching the 200-day EMA at around $4,477 and showing a slight recovery. We could expect it to continue rising in the coming hours and days if the price consolidates above $4,460.
Given that gold has reached the 61.8% Fibonacci zone, if the price remains above the 200 EMA, this could be seen as a positive signal to buy. However, if the price falls below the 200 EMA and below $4,470, the outlook could turn negative, and we could expect it to reach the 6/8 Murray level around $4,375.
The daily gold chart shows that it is at a turning point. If the price consolidates above $4,477, it could be seen as a positive buy signal, with targets at the 38.2% Fibonacci level around $4,600. The instrument could even reach the 23.6% Fibonacci level around $4,730.
The Eagle indicator is showing a positive signal, hence we believe gold could rise in the coming hours. To confirm this, we must carefully monitor whether the price remains above the 200 EMA, which could signal a bullish trend and present a buying opportunity.
*El análisis de mercado publicado aquí tiene la finalidad de incrementar su conocimiento, más no darle instrucciones para realizar una operación.
¡Los informes analíticos de InstaSpot lo mantendrá bien informado de las tendencias del mercado! Al ser un cliente de InstaSpot, se le proporciona una gran cantidad de servicios gratuitos para una operación eficiente.


