


The legend in the InstaSpot team!
Legend! You think that's bombastic rhetoric? But how should we call a man, who became the first Asian to win the junior world chess championship at 18 and who became the first Indian Grandmaster at 19? That was the start of a hard path to the World Champion title for Viswanathan Anand, the man who became a part of history of chess forever. Now one more legend in the InstaSpot team!


Borussia is one of the most titled football clubs in Germany, which has repeatedly proved to fans: the spirit of competition and leadership will certainly lead to success. Trade in the same way that sports professionals play the game: confidently and actively. Keep a "pass" from Borussia FC and be in the lead with InstaSpot!

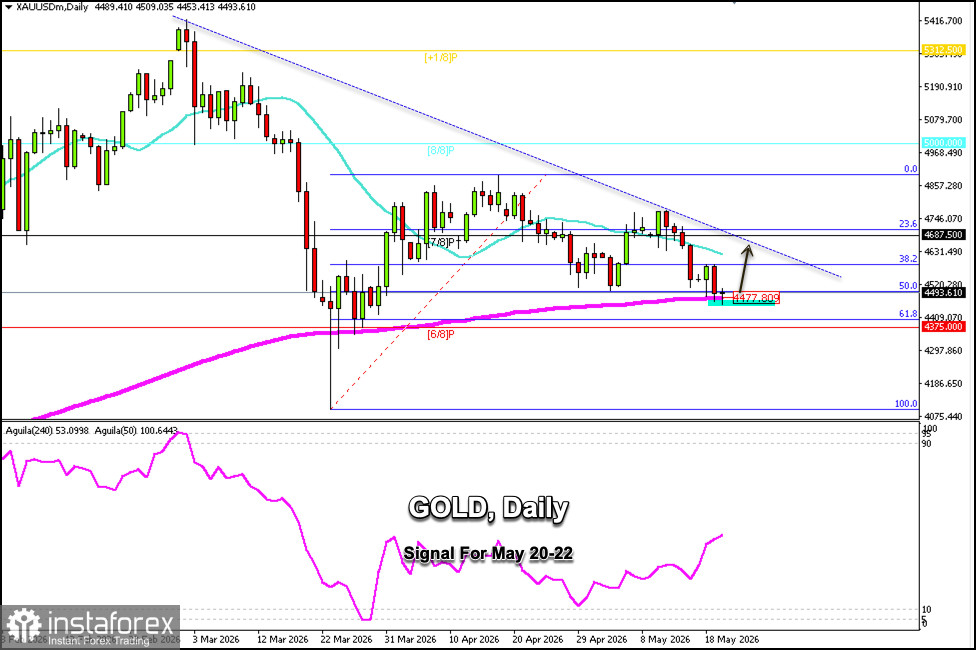
Gold is trading around $4,493, rebounding after reaching the 200-day EMA at around $4,477 and showing a slight recovery. We could expect it to continue rising in the coming hours and days if the price consolidates above $4,460.
Given that gold has reached the 61.8% Fibonacci zone, if the price remains above the 200 EMA, this could be seen as a positive signal to buy. However, if the price falls below the 200 EMA and below $4,470, the outlook could turn negative, and we could expect it to reach the 6/8 Murray level around $4,375.
The daily gold chart shows that it is at a turning point. If the price consolidates above $4,477, it could be seen as a positive buy signal, with targets at the 38.2% Fibonacci level around $4,600. The instrument could even reach the 23.6% Fibonacci level around $4,730.
The Eagle indicator is showing a positive signal, hence we believe gold could rise in the coming hours. To confirm this, we must carefully monitor whether the price remains above the 200 EMA, which could signal a bullish trend and present a buying opportunity.
*এখানে পোস্ট করা মার্কেট বিশ্লেষণ আপনার সচেতনতা বৃদ্ধির জন্য প্রদান করা হয়, ট্রেড করার নির্দেশনা প্রদানের জন্য প্রদান করা হয় না।
ইন্সটাফরেক্স বিশ্লেষণমূলক পর্যালোচনাগুলো আপনাকে মার্কেট প্রবণতা সম্পর্কে পুরোপুরি সচেতন করবে! ইন্সটাফরেক্সের একজন গ্রাহক হওয়ায়, দক্ষ ট্রেডিং এর জন্য আপনাকে অনেক সেবা বিনামূল্যে প্রদান করা হয়।


