


¡Nuestro equipo cuenta con más de 7,000,000 operadores!
Cada día, trabajamos juntos para mejorar las operaciones. Obtenemos grandes resultados y seguimos adelante.
El reconocimiento de millones de operadores en todo el mundo es el mejor agradecimiento a nuestro trabajo! ¡Usted hizo su elección y haremos todo lo que esté a nuestro alcance para satisfacer sus expectativas!
¡Juntos somos un gran equipo!
InstaSpot. ¡Orgulloso de trabajar para usted!


¡Actor, 6 veces ganador del torneo UFC y un verdadero héroe!
El hombre que se hizo a sí mismo. El hombre que sigue nuestro camino.
El secreto detrás del éxito de Taktarov es el constante movimiento hacia el objetivo.
¡Revele todo los lados de su talento!
Descubra, intente, fracase, ¡pero nunca se rinda!
InstaSpot. ¡Su historia de éxito comienza aquí!
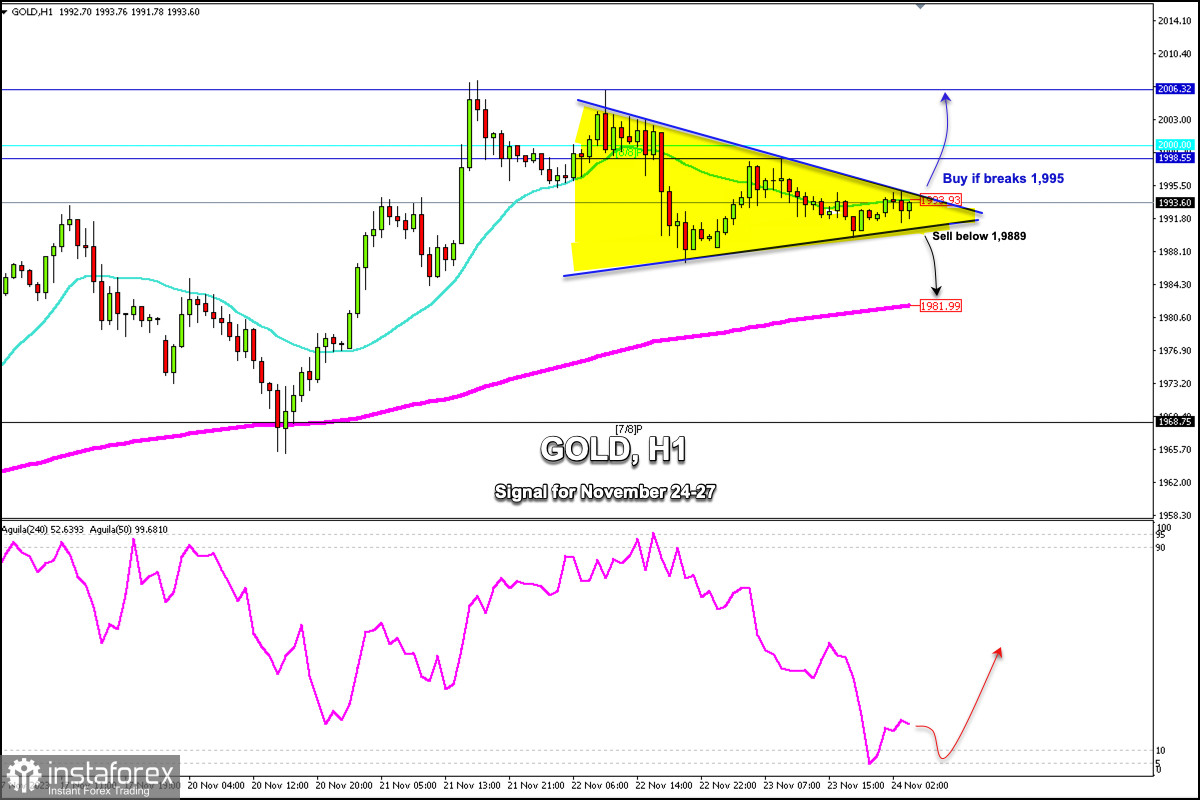
Early in the European session, Gold (XAU/USD) is trading around 1,993.60, below the 21 SMA, and within a symmetrical triangle formed since November 21. XAU/USD broke above the psychological $2,000 level on November 21. Since then, it has been trading within a range of $1,990 to $2,000.
Gold is showing some consolidation. So, if it breaks above 1,995, it could accelerate its upward move and could reach the psychological level of $2,000 and even the area of the 2,006 high.
On the other hand, a sharp break of the symmetrical triangle below 1,989 could accelerate the downward movement and push the price down to 1,981, where the 200 EMA is passing, which could offer immediate support for gold.
A daily close above 2,006 could accelerate the upward momentum and the metal could reach +1/8 Murray at 2,031 and could even reach the April 23rd high around 2,048. Conversely, a drop below the 200 EMA could accelerate the downward movement and the price could reach the 7/8 Murray at 1,968 and could even drop as low as 6/8 Murray at 1,937.
The eagle indicator reached the oversold zone. Hence, gold is likely to continue bouncing in the coming days. Therefore, any pullback could be seen as a buying opportunity only if it consolidates above 1,980 (200 EMA).
Our trading plan for the next few hours is to buy if the price breaks the symmetrical triangle and consolidates above 1,995. Conversely, a break below 1,990 would be seen as a signal to sell with targets at 1,981.
*El análisis de mercado publicado aquí tiene la finalidad de incrementar su conocimiento, más no darle instrucciones para realizar una operación.
¡Los informes analíticos de InstaSpot lo mantendrá bien informado de las tendencias del mercado! Al ser un cliente de InstaSpot, se le proporciona una gran cantidad de servicios gratuitos para una operación eficiente.


