


The legend in the InstaSpot team!
Legend! You think that's bombastic rhetoric? But how should we call a man, who became the first Asian to win the junior world chess championship at 18 and who became the first Indian Grandmaster at 19? That was the start of a hard path to the World Champion title for Viswanathan Anand, the man who became a part of history of chess forever. Now one more legend in the InstaSpot team!


Borussia is one of the most titled football clubs in Germany, which has repeatedly proved to fans: the spirit of competition and leadership will certainly lead to success. Trade in the same way that sports professionals play the game: confidently and actively. Keep a "pass" from Borussia FC and be in the lead with InstaSpot!
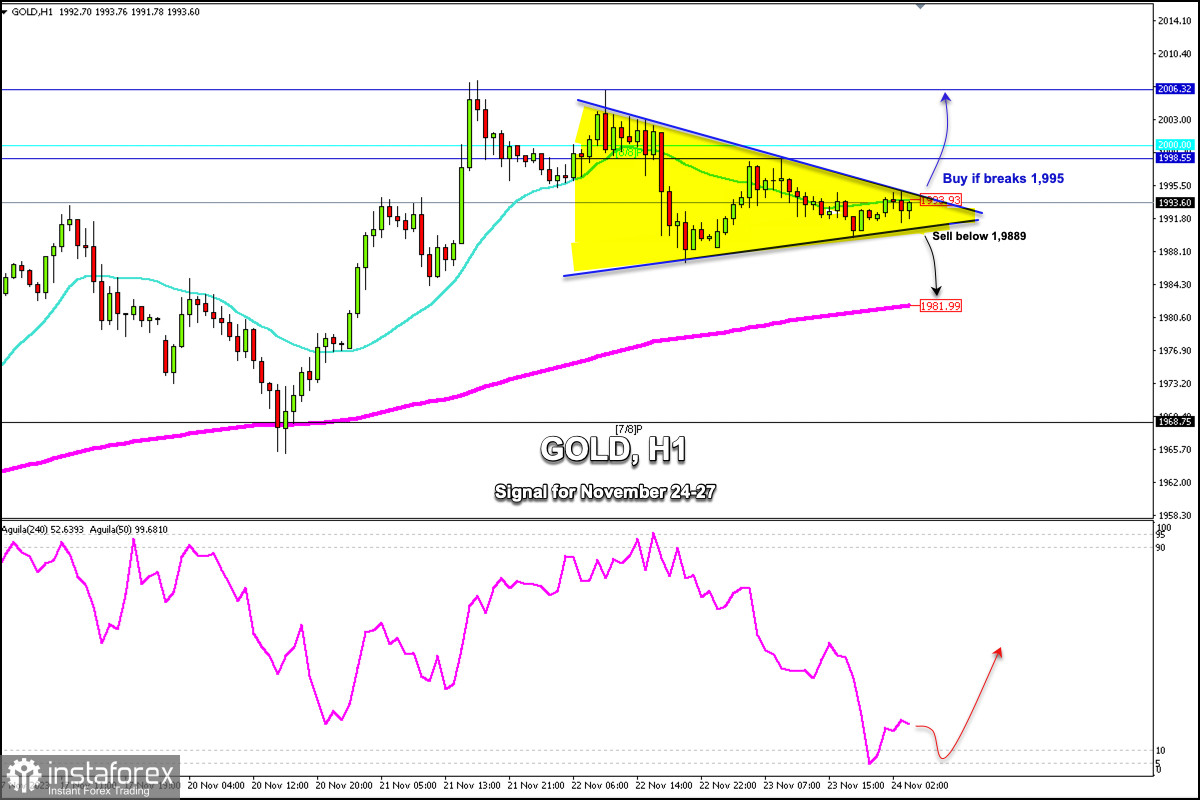
Early in the European session, Gold (XAU/USD) is trading around 1,993.60, below the 21 SMA, and within a symmetrical triangle formed since November 21. XAU/USD broke above the psychological $2,000 level on November 21. Since then, it has been trading within a range of $1,990 to $2,000.
Gold is showing some consolidation. So, if it breaks above 1,995, it could accelerate its upward move and could reach the psychological level of $2,000 and even the area of the 2,006 high.
On the other hand, a sharp break of the symmetrical triangle below 1,989 could accelerate the downward movement and push the price down to 1,981, where the 200 EMA is passing, which could offer immediate support for gold.
A daily close above 2,006 could accelerate the upward momentum and the metal could reach +1/8 Murray at 2,031 and could even reach the April 23rd high around 2,048. Conversely, a drop below the 200 EMA could accelerate the downward movement and the price could reach the 7/8 Murray at 1,968 and could even drop as low as 6/8 Murray at 1,937.
The eagle indicator reached the oversold zone. Hence, gold is likely to continue bouncing in the coming days. Therefore, any pullback could be seen as a buying opportunity only if it consolidates above 1,980 (200 EMA).
Our trading plan for the next few hours is to buy if the price breaks the symmetrical triangle and consolidates above 1,995. Conversely, a break below 1,990 would be seen as a signal to sell with targets at 1,981.
*这里的市场分析是为了增加您对市场的了解,而不是给出交易的指示。
InstaSpot分析评论将让您充分了解市场趋势! 作为InstaSpot的客户,您将获得大量的免费服务以实现有效的交易。


