


¡Nuestro equipo cuenta con más de 7,000,000 operadores!
Cada día, trabajamos juntos para mejorar las operaciones. Obtenemos grandes resultados y seguimos adelante.
El reconocimiento de millones de operadores en todo el mundo es el mejor agradecimiento a nuestro trabajo! ¡Usted hizo su elección y haremos todo lo que esté a nuestro alcance para satisfacer sus expectativas!
¡Juntos somos un gran equipo!
InstaSpot. ¡Orgulloso de trabajar para usted!


¡Actor, 6 veces ganador del torneo UFC y un verdadero héroe!
El hombre que se hizo a sí mismo. El hombre que sigue nuestro camino.
El secreto detrás del éxito de Taktarov es el constante movimiento hacia el objetivo.
¡Revele todo los lados de su talento!
Descubra, intente, fracase, ¡pero nunca se rinda!
InstaSpot. ¡Su historia de éxito comienza aquí!
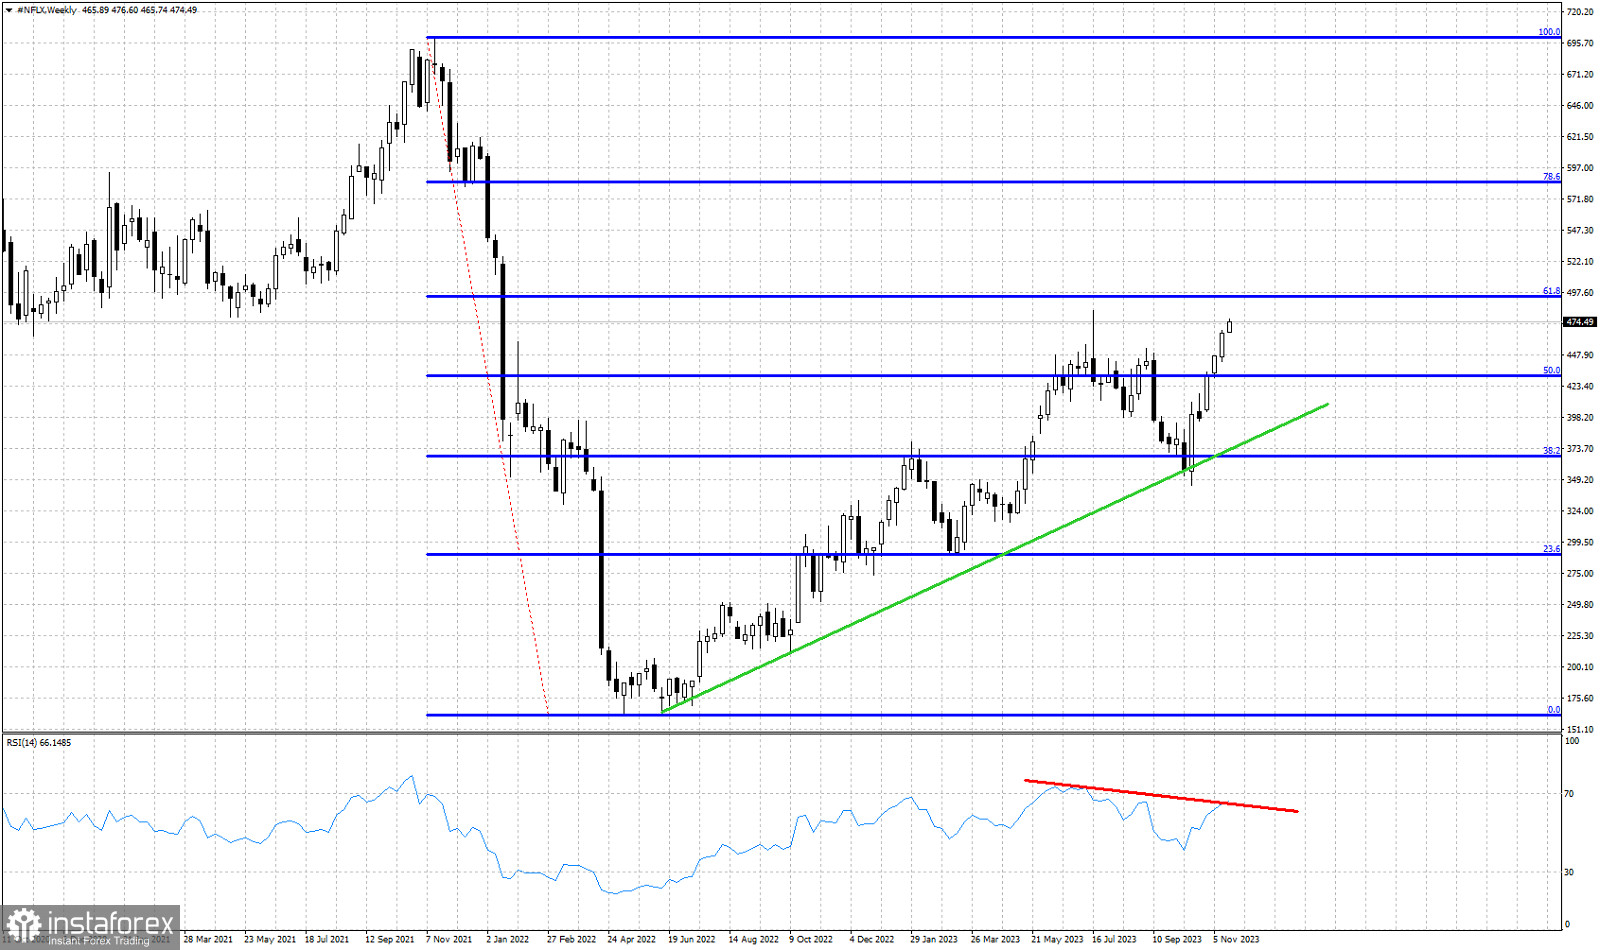
Red lines- bearish RSI divergence
Blue lines- Fibonacci retracement levels
Green line- support trend line
NFLX stock price is trading around $474 making new highs relative to last week and breaking above levels not seen since July. Price is approaching once again the major Fibonacci resistance level at $492. NFLX stock price is currently in an impressive vertical run to the upside erasing the losses of the last few months. Last week's close was above the highest weekly close of 2023. Only on intraday basis has price seen higher levels at $483 back in July. Current momentum suggests that we will break above this level and re-test the 61.8% Fibonacci retracement. The bearish RSI divergence is a warning that should not be ignored. However we have no weekly reversal signal. The Green trend line providing support at $374 remains our key indicator of the medium-term trend. A rejection at the 61.8% retracement will create a double top. This is not something bulls want to see.
*El análisis de mercado publicado aquí tiene la finalidad de incrementar su conocimiento, más no darle instrucciones para realizar una operación.
¡Los informes analíticos de InstaSpot lo mantendrá bien informado de las tendencias del mercado! Al ser un cliente de InstaSpot, se le proporciona una gran cantidad de servicios gratuitos para una operación eficiente.


