


The legend in the InstaSpot team!
Legend! You think that's bombastic rhetoric? But how should we call a man, who became the first Asian to win the junior world chess championship at 18 and who became the first Indian Grandmaster at 19? That was the start of a hard path to the World Champion title for Viswanathan Anand, the man who became a part of history of chess forever. Now one more legend in the InstaSpot team!


Borussia is one of the most titled football clubs in Germany, which has repeatedly proved to fans: the spirit of competition and leadership will certainly lead to success. Trade in the same way that sports professionals play the game: confidently and actively. Keep a "pass" from Borussia FC and be in the lead with InstaSpot!

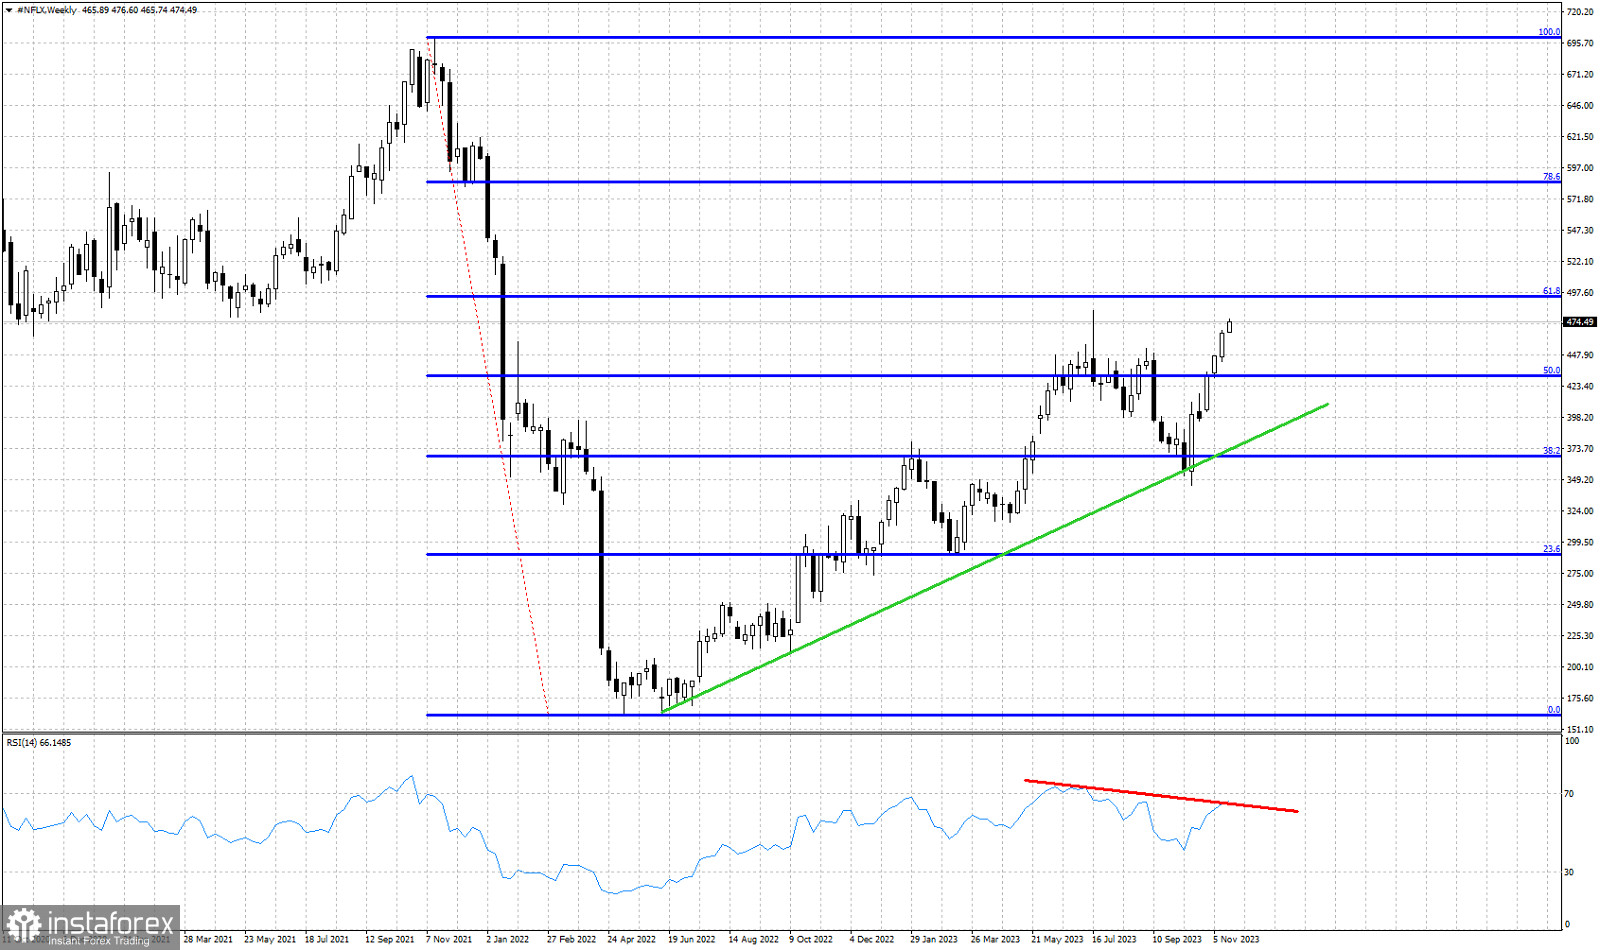
Red lines- bearish RSI divergence
Blue lines- Fibonacci retracement levels
Green line- support trend line
NFLX stock price is trading around $474 making new highs relative to last week and breaking above levels not seen since July. Price is approaching once again the major Fibonacci resistance level at $492. NFLX stock price is currently in an impressive vertical run to the upside erasing the losses of the last few months. Last week's close was above the highest weekly close of 2023. Only on intraday basis has price seen higher levels at $483 back in July. Current momentum suggests that we will break above this level and re-test the 61.8% Fibonacci retracement. The bearish RSI divergence is a warning that should not be ignored. However we have no weekly reversal signal. The Green trend line providing support at $374 remains our key indicator of the medium-term trend. A rejection at the 61.8% retracement will create a double top. This is not something bulls want to see.
*The market analysis posted here is meant to increase your awareness, but not to give instructions to make a trade.
InstaSpot analytical reviews will make you fully aware of market trends! Being an InstaSpot client, you are provided with a large number of free services for efficient trading.


