


¡La leyenda en el equipo de InstaSpot!
¡Leyenda! ¿Cree que es una retórica grandilocuente? Pero, ¿cómo deberíamos llamar a un hombre, que se convirtió en el primer asiático en ganar el campeonato mundial de ajedrez júnior a los 18 años y en el primer Gran Maestro indio a los 19 años? Ese fue el comienzo de un camino difícil hacia el título de Campeón del Mundo para Viswanathan Anand, el hombre que se convirtió en parte de la historia del ajedrez para siempre. ¡Ahora una leyenda más en el equipo de InstaSpot!


Borussia es uno de los clubes de fútbol con más títulos en Alemania, que ha demostrado repetidamente a los fanáticos: el espíritu de competencia y liderazgo que ciertamente conducirán al éxito. Opere de la misma manera que los profesionales del deporte: con confianza y de forma activa. ¡Mantenga un "pase" del Borussia FC y lidere con InstaSpot!
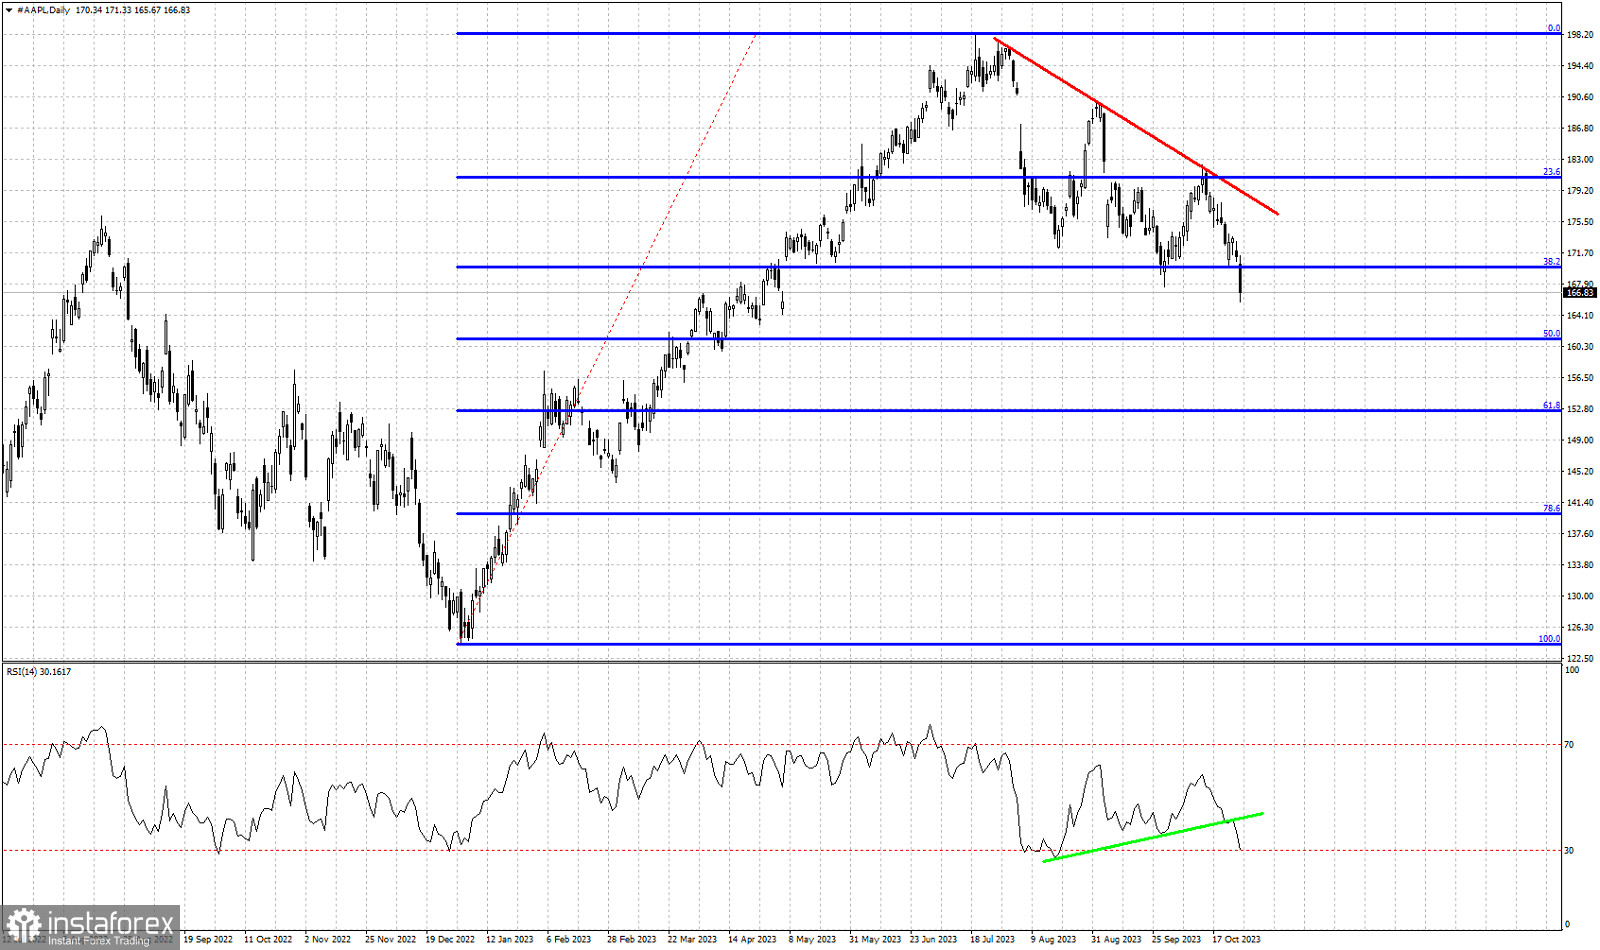
Red line- bearish trend line
Blue lines- Fibonacci retracement levels
Green line- RSI support trend line
In recent analysis on the AAPL stock we warned traders that as long as price is below the red downward sloping resistance trend line, AAPL stock price will be vulnerable to a move to lower lows. Recently price got rejected for a second time at the red trend line resistance. Price pulled back towards $170 near where the previous low was made. The RSI also paused its decline at the green support trend line. In the end bears were stronger and selling pressures pushed price to new lows and the RSI below the green trend line but not at new lows. At this current downward wave it is very important to see if the RSI makes a lower low or if it provides bullish divergence. The next key Fibonacci support level is at the 50% retracement around $161.
*El análisis de mercado publicado aquí tiene la finalidad de incrementar su conocimiento, más no darle instrucciones para realizar una operación.
¡Los informes analíticos de InstaSpot lo mantendrá bien informado de las tendencias del mercado! Al ser un cliente de InstaSpot, se le proporciona una gran cantidad de servicios gratuitos para una operación eficiente.


