


Legenda dalam pasukan InstaSpot!
Legenda! Anda fikir ia adalah satu retorik yang besar? Tetapi bagaimana untuk kita memanggil seorang lelaki, yang telah menjadi pemain Asia pertama yang memenangi kejohanan catur dunia junior pada usia 18 tahun dan menjadi Grandmaster India pertama pada usia 19 tahun? Itulah permulaan yang sukar untuk merangkul gelaran Juara Dunia untuk Viswanathan Anand, seorang juara yang telah menjadi sebahagian daripada sejarah catur. Kini satu lagi legenda dalam pasukan InstaSpot!


Borussia adalah salah satu kelab bola sepak paling terkemuka di Jerman, yang telah berulang kali membuktikan kepada peminatnya: semangat persaingan dan kepemimpinan pasti akan membawa kepada kejayaan. Berdagang dengan cara yang sama seperti atlet sukan profesional beraksi menentang lawan: yakin dan aktif. Simpan "hantaran" dari Borussia FC dan menjadi pedagang hebat dengan InstaSpot!

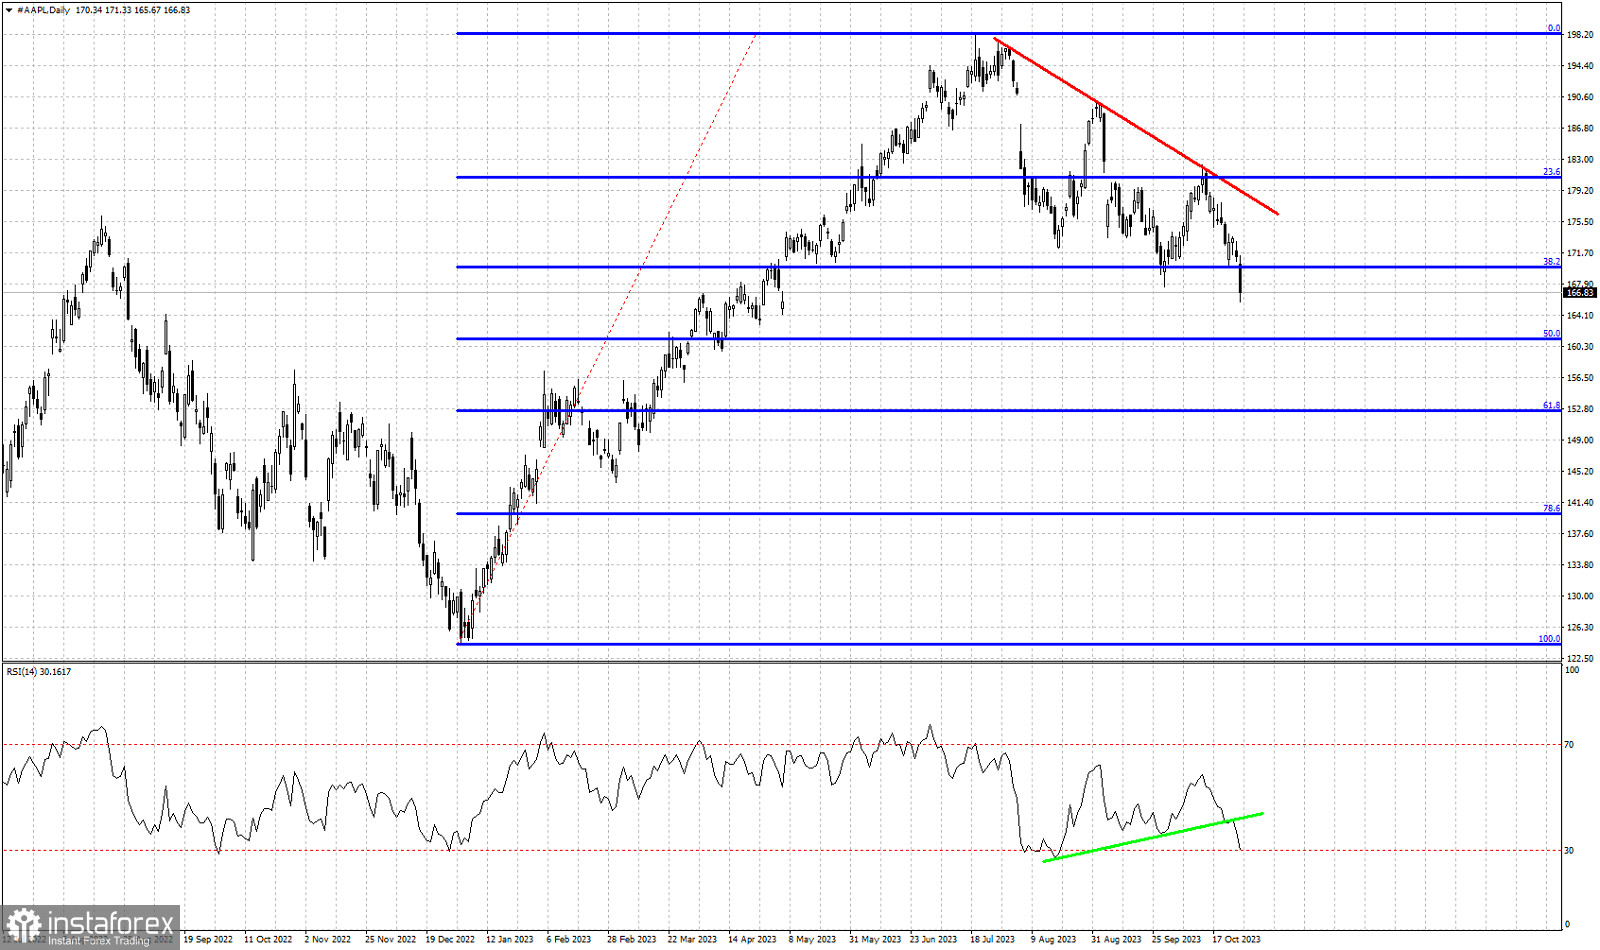
Red line- bearish trend line
Blue lines- Fibonacci retracement levels
Green line- RSI support trend line
In recent analysis on the AAPL stock we warned traders that as long as price is below the red downward sloping resistance trend line, AAPL stock price will be vulnerable to a move to lower lows. Recently price got rejected for a second time at the red trend line resistance. Price pulled back towards $170 near where the previous low was made. The RSI also paused its decline at the green support trend line. In the end bears were stronger and selling pressures pushed price to new lows and the RSI below the green trend line but not at new lows. At this current downward wave it is very important to see if the RSI makes a lower low or if it provides bullish divergence. The next key Fibonacci support level is at the 50% retracement around $161.
* Analisis pasaran yang disiarkan di sini adalah bertujuan untuk meningkatkan kesedaran anda, tetapi tidak untuk memberi arahan untuk membuat perdagangan.
Kajian analisis InstaSpot akan membuat anda mengetahui sepenuhnya aliran pasaran! Sebagai pelanggan InstaSpot, anda disediakan sejumlah besar perkhidmatan percuma untuk dagangan yang cekap.


