


¡Nuestro equipo cuenta con más de 7,000,000 operadores!
Cada día, trabajamos juntos para mejorar las operaciones. Obtenemos grandes resultados y seguimos adelante.
El reconocimiento de millones de operadores en todo el mundo es el mejor agradecimiento a nuestro trabajo! ¡Usted hizo su elección y haremos todo lo que esté a nuestro alcance para satisfacer sus expectativas!
¡Juntos somos un gran equipo!
InstaSpot. ¡Orgulloso de trabajar para usted!


¡Actor, 6 veces ganador del torneo UFC y un verdadero héroe!
El hombre que se hizo a sí mismo. El hombre que sigue nuestro camino.
El secreto detrás del éxito de Taktarov es el constante movimiento hacia el objetivo.
¡Revele todo los lados de su talento!
Descubra, intente, fracase, ¡pero nunca se rinda!
InstaSpot. ¡Su historia de éxito comienza aquí!
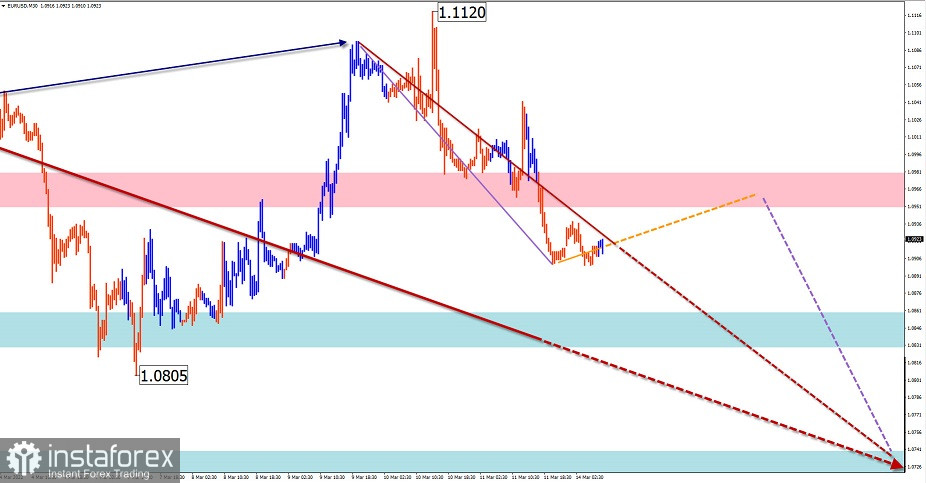
EUR/USD
Analysis:
The direction of the trend of the European currency since the beginning of last year continues to be set by a downward wave. On March 9, the hidden correction of the last trend section from February 4, which has the form of a shifting plane, was completed. The subsequent decline has a reversal potential.
Forecast:
Today, the general lateral course of the pair's movement is more likely. In the first half of the day, an upward vector is not excluded, no further than the calculated resistance. At the end of the day or tomorrow, you can wait for the resumption of the downward direction of movement. If the nearest support breaks, the decline will continue to the next zone.
Potential reversal zones
Resistance:
- 1.0950/1.0980
Support:
- 1.0860/1.0830
- 1.0740/1.0710
Recommendations:
There are no conditions for purchases on the euro market today. In the area of the calculated resistance, it is recommended to monitor the emerging reversal signals for the sale of the instrument.
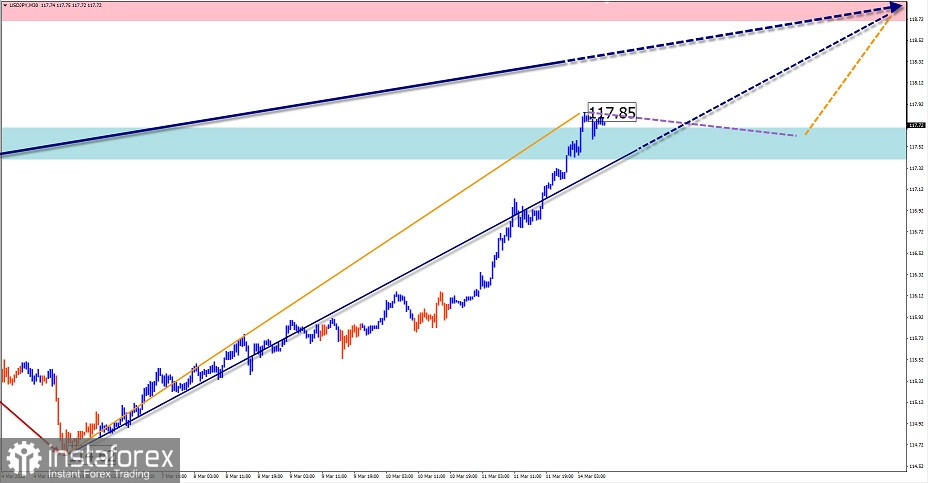
USD/JPY
Analysis:
The unfinished section of the dominant bullish trend of the Japanese yen major has been counting down since November 30 last year. On March 4, the final part (C) started. By now, the structure of this wave looks complete. The price is approaching the lower boundary of a strong potential reversal zone of the weekly chart scale.
Forecast:
The general upward movement vector is expected to continue in the near future. In the first half of the day, a flat mood is not excluded, along the boundaries of the settlement support.
Potential reversal zones
Resistance:
- 118.70/119.00
Support:
- 117.70/117.40
Recommendations:
There will be no conditions for the sale of the Japanese yen during the current day. It is recommended to monitor emerging signals for the purchase of a pair in the settlement support area.
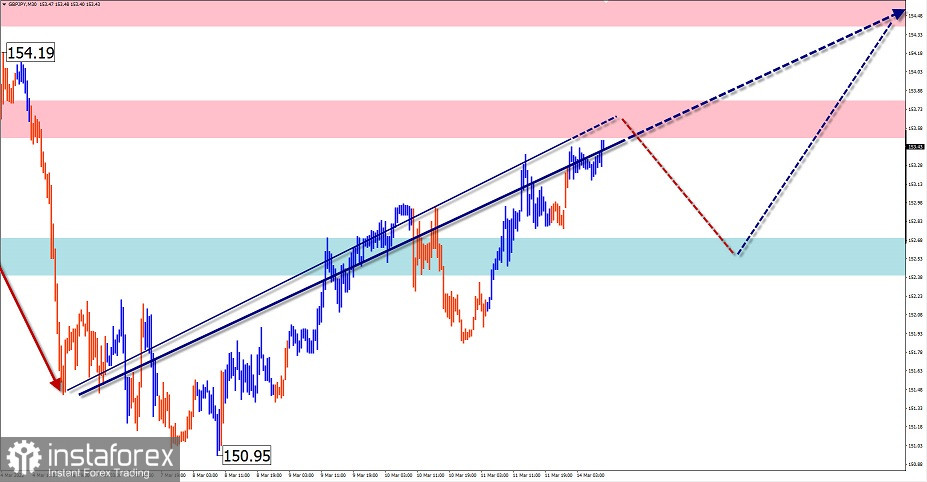
GBP/JPY
Analysis:
On the chart of the pound/yen cross, the main direction of movement is set by the downward wave from January 4. The counter section from March 4 does not go beyond the correction of the last section (C) of the main wave but has sufficient wave potential for further development. The price has reached the resistance level of the weekly scale.
Forecast:
During the next day, the movement is expected to move mainly to the lateral plane, in the price corridor between the nearest oncoming zones. When the price rise resumes, then you can expect a breakthrough of the upper limit of the nearest resistance and a rise in the rate to the next resistance.
Potential reversal zones
Resistance:
- 154.40/154.70
- 153.50/153.80
Support:
- 152.70/152.40
Recommendations:
Trading on the pair's market today is more risky and can lead to deposit losses. It is optimal to refrain from entering the pair's market until the end of the upcoming pullback, with a search at its end for buy signals.
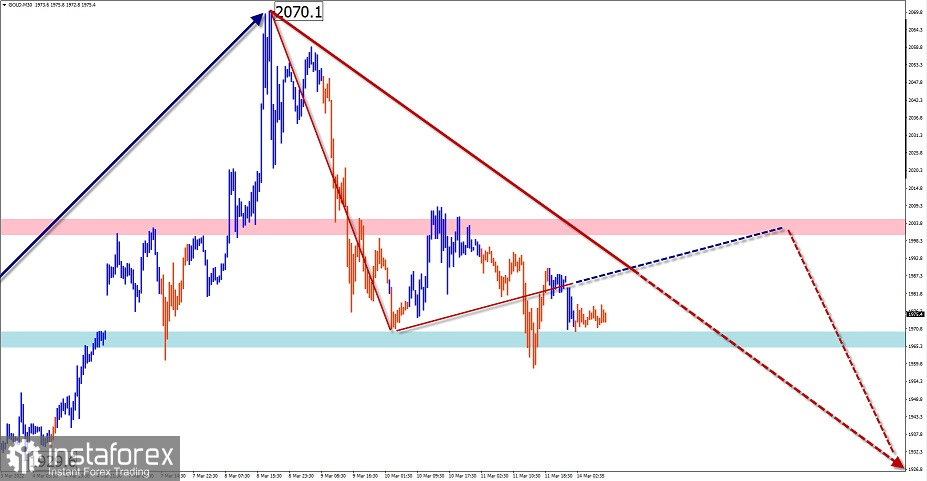
GOLD
Analysis:
At the end of the dominant upward wave of the gold chart, a counter corrective wave zigzag has been forming since March 8. Since the end of last week, the middle part (B) has been developing, after which the depreciation will continue.
Forecast:
The general lateral vector of gold movement is expected to continue in the next day. In the first half of the day, the rate is expected to rise from the support zone to the calculated resistance zone. Then you can wait for the formation of a reversal and a repeated price reduction.
Potential reversal zones
Resistance:
- 2000.0/2005.0
Support:
- 1970.0/1965.0
Recommendations:
Trading gold today in a flat environment can be unprofitable. It is recommended to refrain from entering the market of the instrument until confirmed signals for sale appear in the area of the resistance zone.
Explanations: In the simplified wave analysis (UVA), waves consist of 3 parts (A-B-C). The last incomplete wave is analyzed. The solid background of the arrows shows the formed structure, and the dotted one shows the expected movements.
Attention: The wave algorithm does not take into account the duration of the movements of the instrument in time!
*El análisis de mercado publicado aquí tiene la finalidad de incrementar su conocimiento, más no darle instrucciones para realizar una operación.
¡Los informes analíticos de InstaSpot lo mantendrá bien informado de las tendencias del mercado! Al ser un cliente de InstaSpot, se le proporciona una gran cantidad de servicios gratuitos para una operación eficiente.


