


الأسطورة فى فريق إنستافوركس!
الأسطورة! هل تعتقد أن هذا هو الخطاب المنمق؟ ولكن كيف ينبغي أن نطلق على الرجل، الذي أصبح أول آسيوي يفوز ببطولة العالم للشطرنج للشباب بعمر 18 سنة والذي أصبح أول أستاذ كبير هندي في سن 19؟ وكانت هذه بداية طريق صعب إلى لقب بطل العالم لـ فيسواناثان أناند، الرجل الذي أصبح جزءًا من تاريخ الشطرنج إلى الأبد. والآن أسطورة آخر في فريق إنستافوركس!


يعتبر بوروسيا دورتموند أحد أكثر أندية كرة القدم حصولاً على الألقاب في ألمانيا، وقد أثبت ذلك مرارًا وتكرارًا للجماهير: فإنّ روح المنافسة والقيادة ستؤدي بالتأكيد إلى النجاح. قم بالتداول بنفس الطريقة التي يلعب بها المحترفون الرياضيون اللعبة: بثقة ونشاط. احتفظ بـ "ترخيص دخول" من نادي بوروسيا دورتموند لكرة القدم وكن في الصدارة مع إنستافوركس!
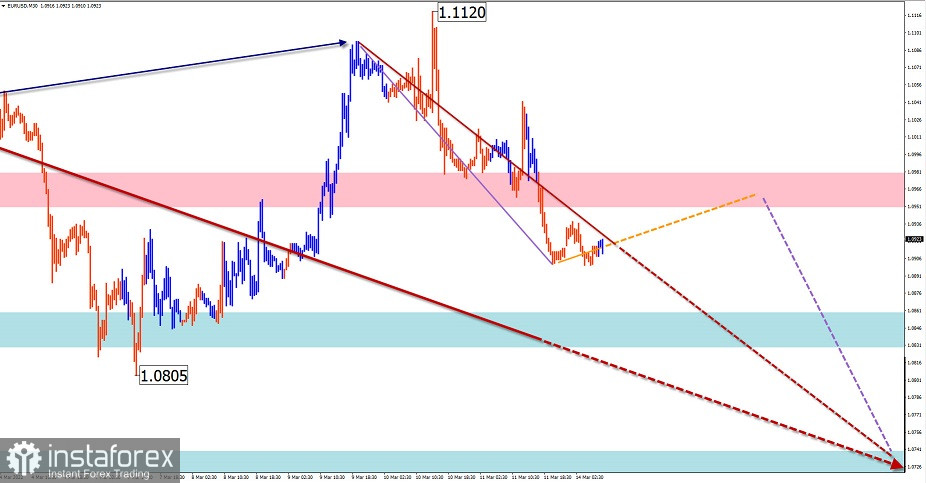
EUR/USD
Analysis:
The direction of the trend of the European currency since the beginning of last year continues to be set by a downward wave. On March 9, the hidden correction of the last trend section from February 4, which has the form of a shifting plane, was completed. The subsequent decline has a reversal potential.
Forecast:
Today, the general lateral course of the pair's movement is more likely. In the first half of the day, an upward vector is not excluded, no further than the calculated resistance. At the end of the day or tomorrow, you can wait for the resumption of the downward direction of movement. If the nearest support breaks, the decline will continue to the next zone.
Potential reversal zones
Resistance:
- 1.0950/1.0980
Support:
- 1.0860/1.0830
- 1.0740/1.0710
Recommendations:
There are no conditions for purchases on the euro market today. In the area of the calculated resistance, it is recommended to monitor the emerging reversal signals for the sale of the instrument.
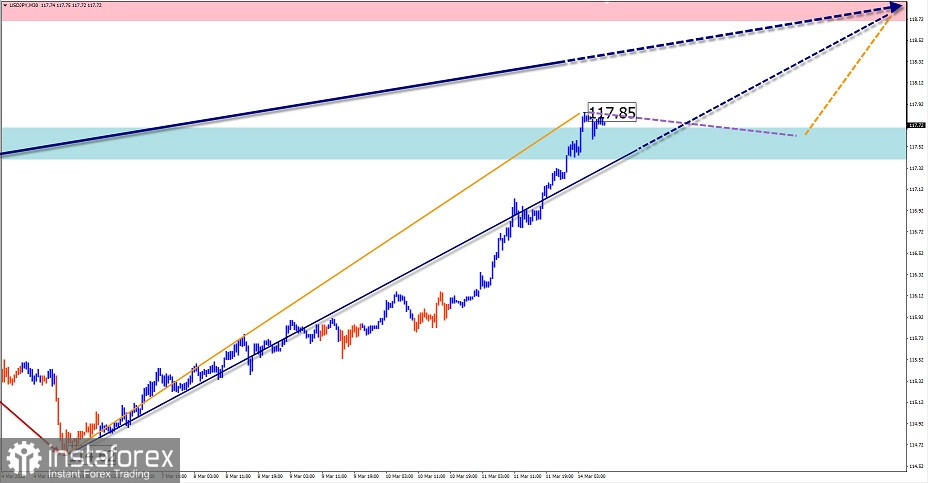
USD/JPY
Analysis:
The unfinished section of the dominant bullish trend of the Japanese yen major has been counting down since November 30 last year. On March 4, the final part (C) started. By now, the structure of this wave looks complete. The price is approaching the lower boundary of a strong potential reversal zone of the weekly chart scale.
Forecast:
The general upward movement vector is expected to continue in the near future. In the first half of the day, a flat mood is not excluded, along the boundaries of the settlement support.
Potential reversal zones
Resistance:
- 118.70/119.00
Support:
- 117.70/117.40
Recommendations:
There will be no conditions for the sale of the Japanese yen during the current day. It is recommended to monitor emerging signals for the purchase of a pair in the settlement support area.
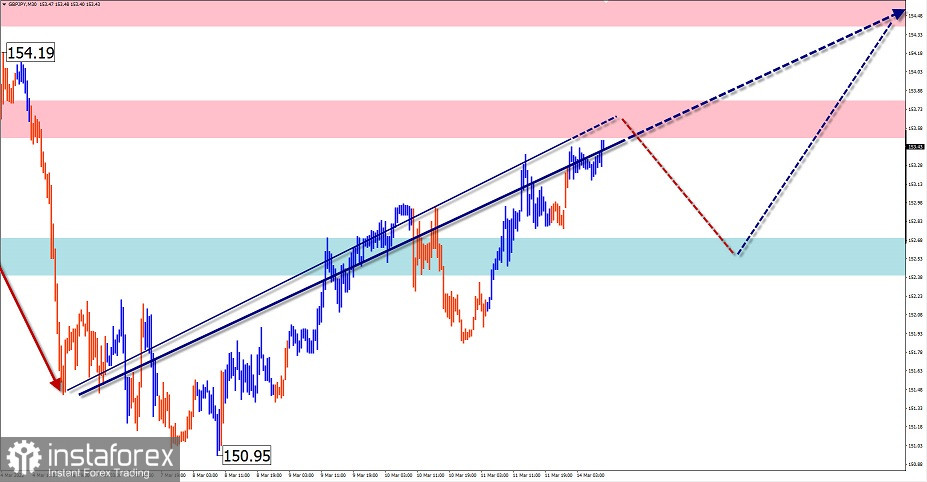
GBP/JPY
Analysis:
On the chart of the pound/yen cross, the main direction of movement is set by the downward wave from January 4. The counter section from March 4 does not go beyond the correction of the last section (C) of the main wave but has sufficient wave potential for further development. The price has reached the resistance level of the weekly scale.
Forecast:
During the next day, the movement is expected to move mainly to the lateral plane, in the price corridor between the nearest oncoming zones. When the price rise resumes, then you can expect a breakthrough of the upper limit of the nearest resistance and a rise in the rate to the next resistance.
Potential reversal zones
Resistance:
- 154.40/154.70
- 153.50/153.80
Support:
- 152.70/152.40
Recommendations:
Trading on the pair's market today is more risky and can lead to deposit losses. It is optimal to refrain from entering the pair's market until the end of the upcoming pullback, with a search at its end for buy signals.
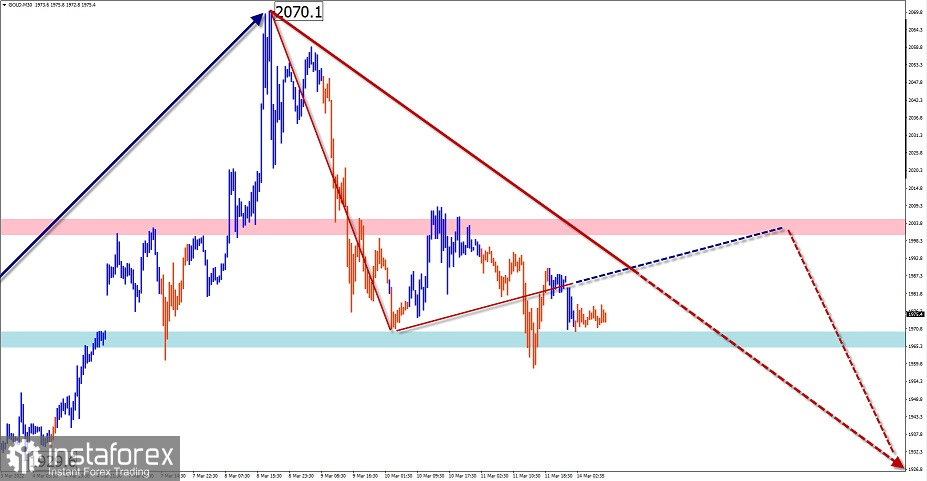
GOLD
Analysis:
At the end of the dominant upward wave of the gold chart, a counter corrective wave zigzag has been forming since March 8. Since the end of last week, the middle part (B) has been developing, after which the depreciation will continue.
Forecast:
The general lateral vector of gold movement is expected to continue in the next day. In the first half of the day, the rate is expected to rise from the support zone to the calculated resistance zone. Then you can wait for the formation of a reversal and a repeated price reduction.
Potential reversal zones
Resistance:
- 2000.0/2005.0
Support:
- 1970.0/1965.0
Recommendations:
Trading gold today in a flat environment can be unprofitable. It is recommended to refrain from entering the market of the instrument until confirmed signals for sale appear in the area of the resistance zone.
Explanations: In the simplified wave analysis (UVA), waves consist of 3 parts (A-B-C). The last incomplete wave is analyzed. The solid background of the arrows shows the formed structure, and the dotted one shows the expected movements.
Attention: The wave algorithm does not take into account the duration of the movements of the instrument in time!
*The market analysis posted here is meant to increase your awareness, but not to give instructions to make a trade.
InstaSpot analytical reviews will make you fully aware of market trends! Being an InstaSpot client, you are provided with a large number of free services for efficient trading.


