


¡Nuestro equipo cuenta con más de 7,000,000 operadores!
Cada día, trabajamos juntos para mejorar las operaciones. Obtenemos grandes resultados y seguimos adelante.
El reconocimiento de millones de operadores en todo el mundo es el mejor agradecimiento a nuestro trabajo! ¡Usted hizo su elección y haremos todo lo que esté a nuestro alcance para satisfacer sus expectativas!
¡Juntos somos un gran equipo!
InstaSpot. ¡Orgulloso de trabajar para usted!


¡Actor, 6 veces ganador del torneo UFC y un verdadero héroe!
El hombre que se hizo a sí mismo. El hombre que sigue nuestro camino.
El secreto detrás del éxito de Taktarov es el constante movimiento hacia el objetivo.
¡Revele todo los lados de su talento!
Descubra, intente, fracase, ¡pero nunca se rinda!
InstaSpot. ¡Su historia de éxito comienza aquí!
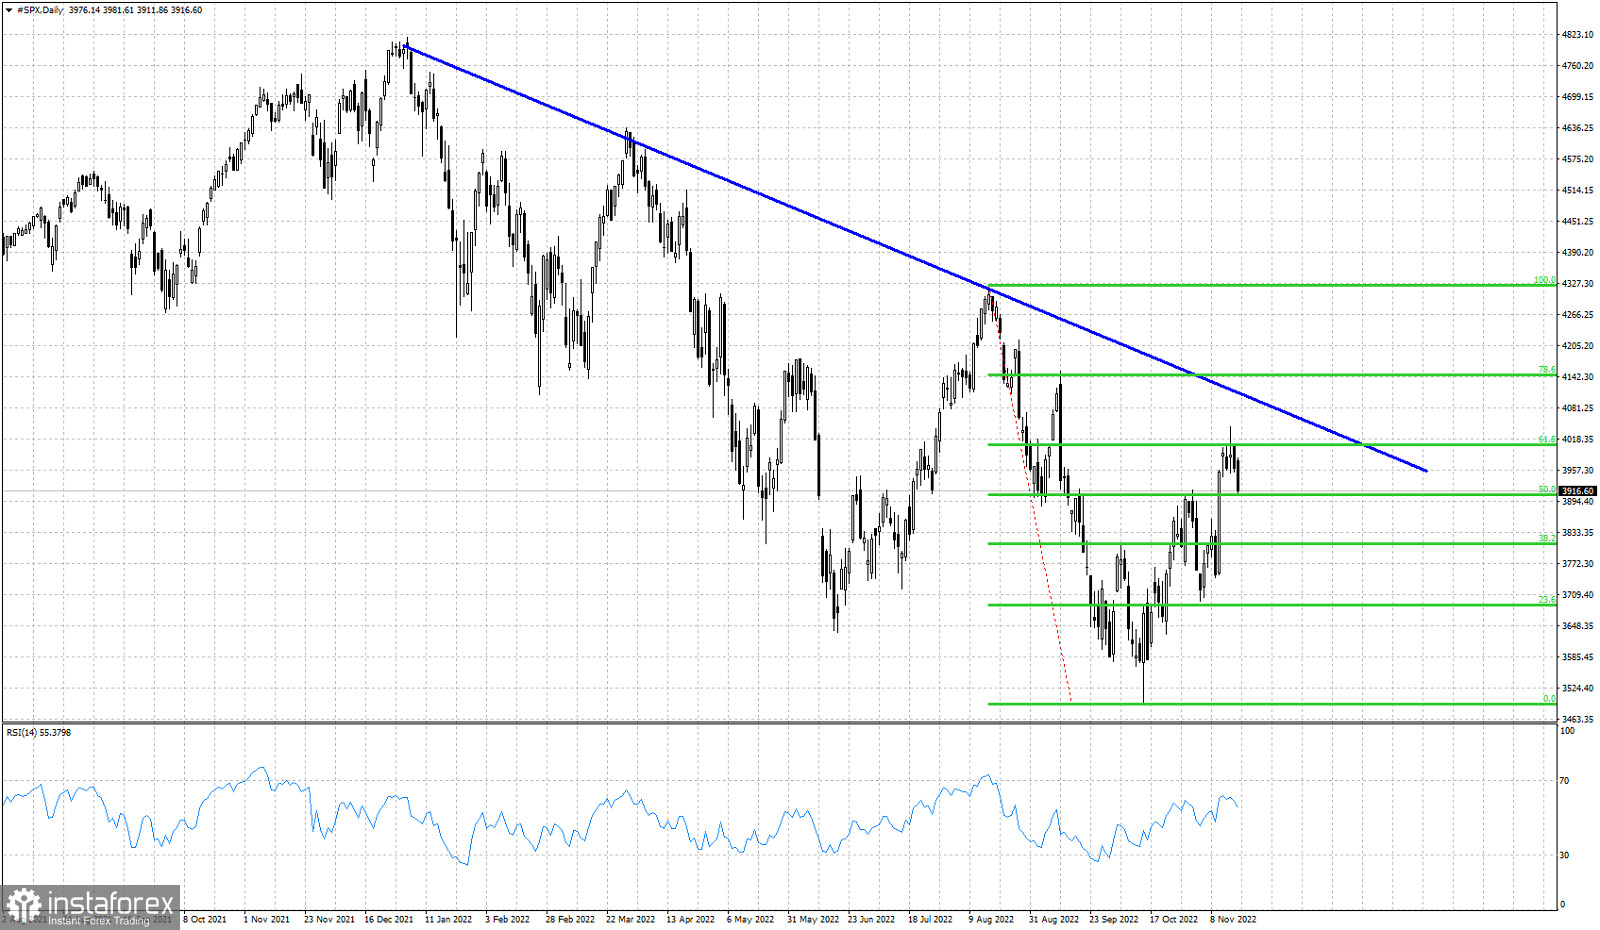
Blue line- resistance
Green lines- Fibonacci retracements
SPX is in a short-term bullish trend from the low of 3490 as it continues making higher highs and higher lows. Price remains below the blue downward sloping resistance trend line. Price has so far retraced 61.8% of the decline from the August high of 4324. The 61.8% retracement is a level we usually see trend reversals. As long as price is trading below the blue trend line resistance, bears will have the upper hand. In this upward movement the RSI has not reached overbought levels. Price has not tested the blue trend line. Despite recent pull back from 4042 to 3900, there is still upside potential towards 4100. But this is not enough for a bullish position to be favored with the current market conditions. Support is at 3700. A break below this level will strengthen bears and provide us a new bearish signal. Taking a look at the longer time frame we see SPX still forming lower highs over the last 12 months. Will this trend continue? Staying below the blue trend line will help bears retain control of the trend.
*El análisis de mercado publicado aquí tiene la finalidad de incrementar su conocimiento, más no darle instrucciones para realizar una operación.
¡Los informes analíticos de InstaSpot lo mantendrá bien informado de las tendencias del mercado! Al ser un cliente de InstaSpot, se le proporciona una gran cantidad de servicios gratuitos para una operación eficiente.


