


我们的团队有超过700万的操盘手!
我们每天都在一起努力改善交易。我们得到了很高的成绩,并继续前进。
世界各地数以百万计的操盘手的认可是我们工作的最大赞赏! 您做出了您的选择,我们将尽一切努力来满足您的期望!
我们是一个共同的伟大团队!
InstaSpot. 自豪地为您工作!


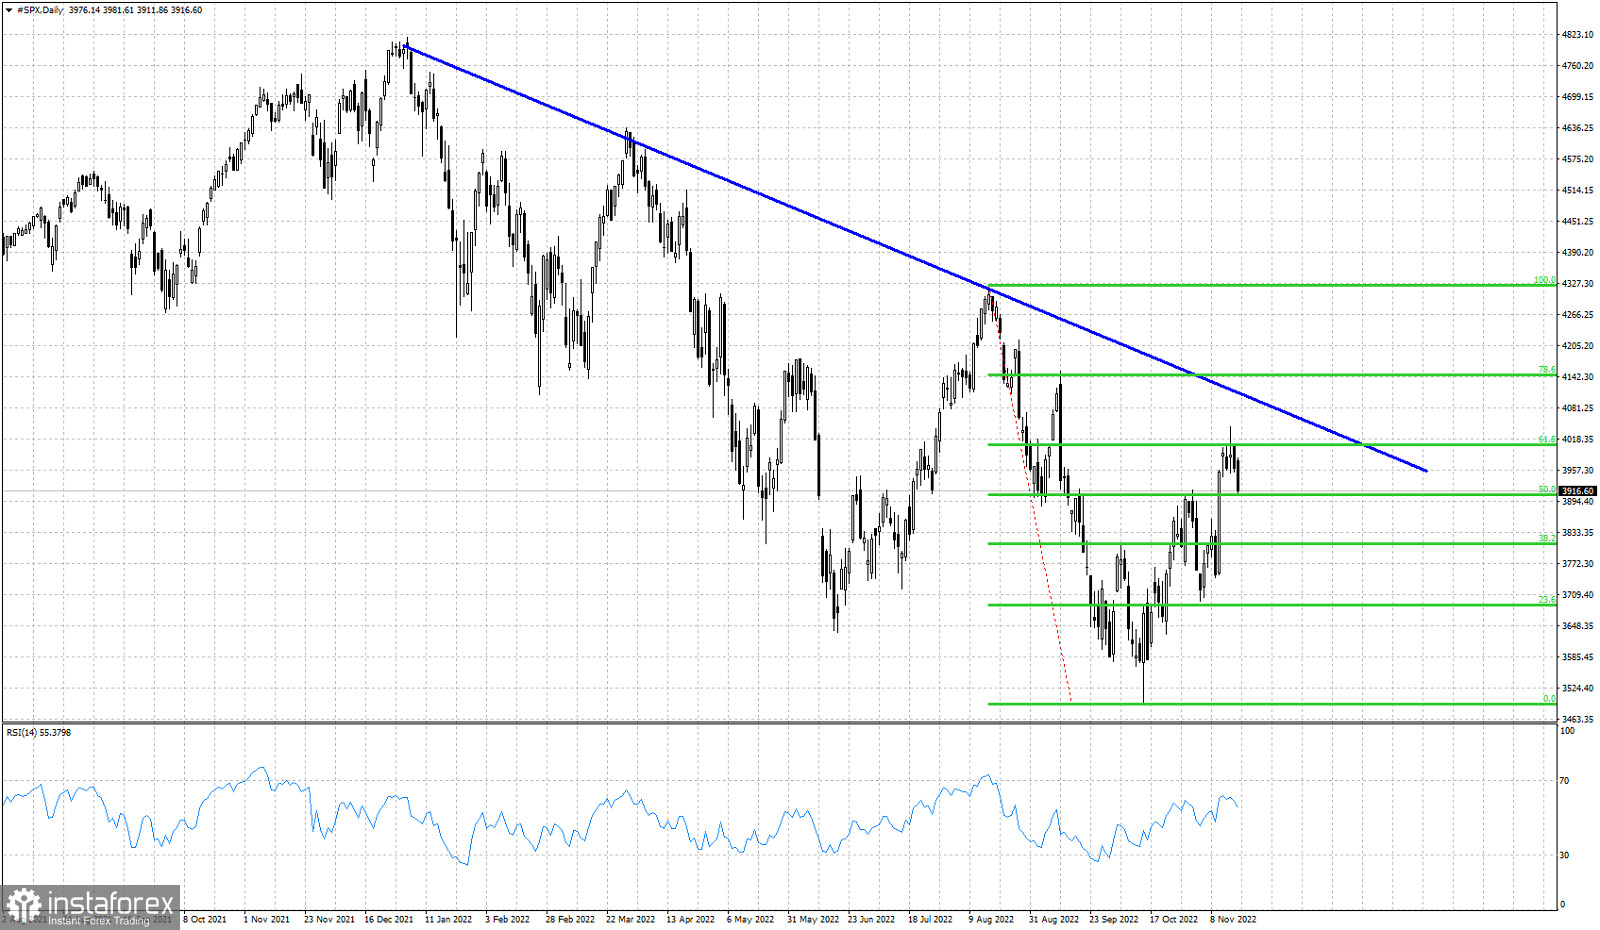
Blue line- resistance
Green lines- Fibonacci retracements
SPX is in a short-term bullish trend from the low of 3490 as it continues making higher highs and higher lows. Price remains below the blue downward sloping resistance trend line. Price has so far retraced 61.8% of the decline from the August high of 4324. The 61.8% retracement is a level we usually see trend reversals. As long as price is trading below the blue trend line resistance, bears will have the upper hand. In this upward movement the RSI has not reached overbought levels. Price has not tested the blue trend line. Despite recent pull back from 4042 to 3900, there is still upside potential towards 4100. But this is not enough for a bullish position to be favored with the current market conditions. Support is at 3700. A break below this level will strengthen bears and provide us a new bearish signal. Taking a look at the longer time frame we see SPX still forming lower highs over the last 12 months. Will this trend continue? Staying below the blue trend line will help bears retain control of the trend.
*这里的市场分析是为了增加您对市场的了解,而不是给出交易的指示。
InstaSpot分析评论将让您充分了解市场趋势! 作为InstaSpot的客户,您将获得大量的免费服务以实现有效的交易。


