


¡Nuestro equipo cuenta con más de 7,000,000 operadores!
Cada día, trabajamos juntos para mejorar las operaciones. Obtenemos grandes resultados y seguimos adelante.
El reconocimiento de millones de operadores en todo el mundo es el mejor agradecimiento a nuestro trabajo! ¡Usted hizo su elección y haremos todo lo que esté a nuestro alcance para satisfacer sus expectativas!
¡Juntos somos un gran equipo!
InstaSpot. ¡Orgulloso de trabajar para usted!


¡Actor, 6 veces ganador del torneo UFC y un verdadero héroe!
El hombre que se hizo a sí mismo. El hombre que sigue nuestro camino.
El secreto detrás del éxito de Taktarov es el constante movimiento hacia el objetivo.
¡Revele todo los lados de su talento!
Descubra, intente, fracase, ¡pero nunca se rinda!
InstaSpot. ¡Su historia de éxito comienza aquí!
The number of applications for unemployment benefits in the US reflected a decrease in their total volume.
Statistics details:
The volume of initial applications for benefits increased from 207 thousand to 230 thousand.
The volume of repeated applications for benefits decreased from 1,753 thousand to 1,559 thousand.
The statistics are positive, which reflected the high dynamics of the recovery of the US labor market. However, traders ignored them.
Analysis of trading charts from January 13:
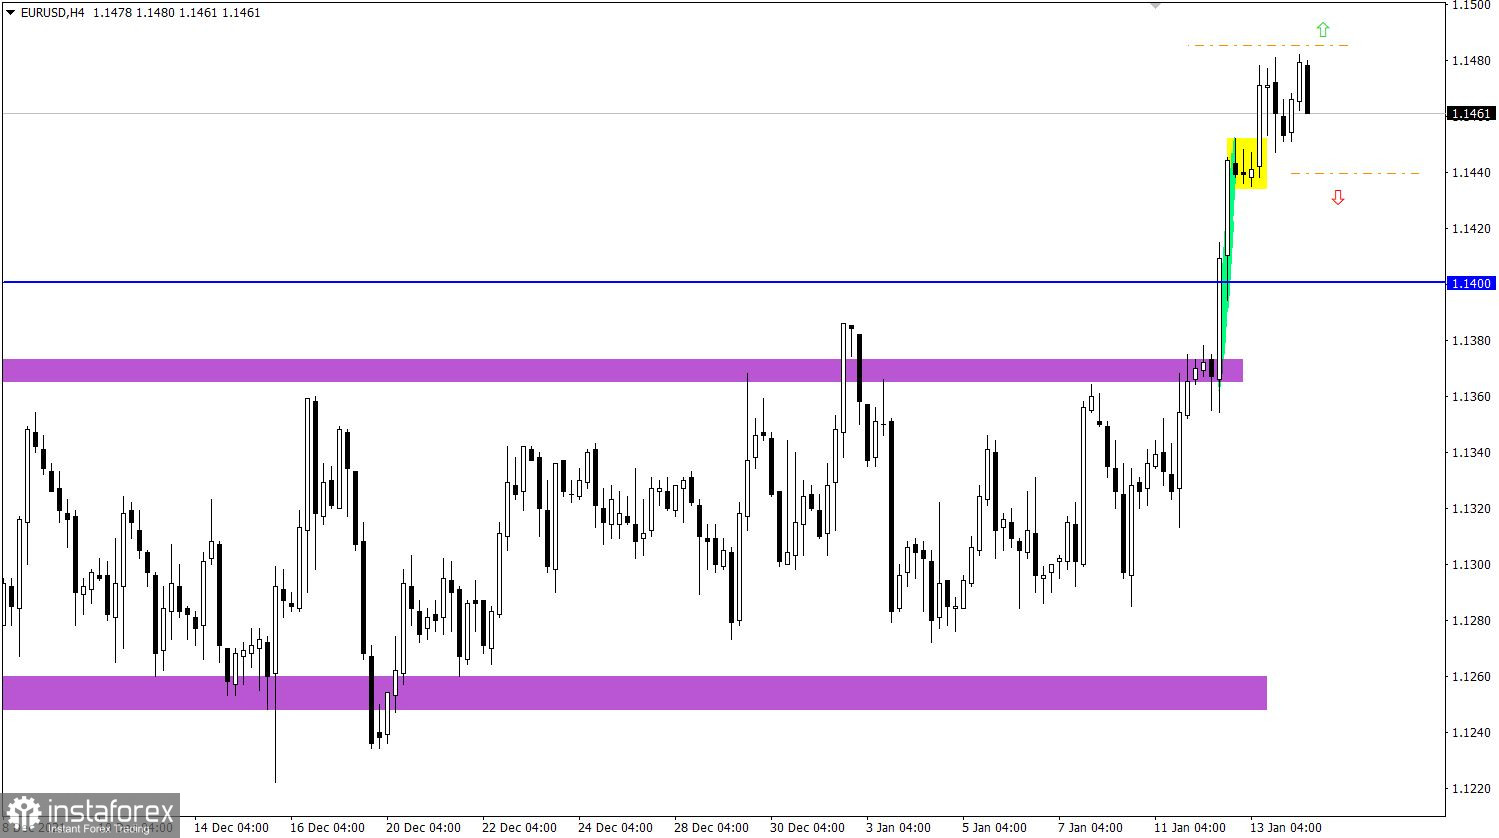
The EUR/USD pair embarked on a cycle of upward inertia after the breakdown of the long-playing side channel, which strengthened the euro by more than 120 points. Despite the growing overbought level, upward interest remains among traders, as indicated by the stepwise course of the price.
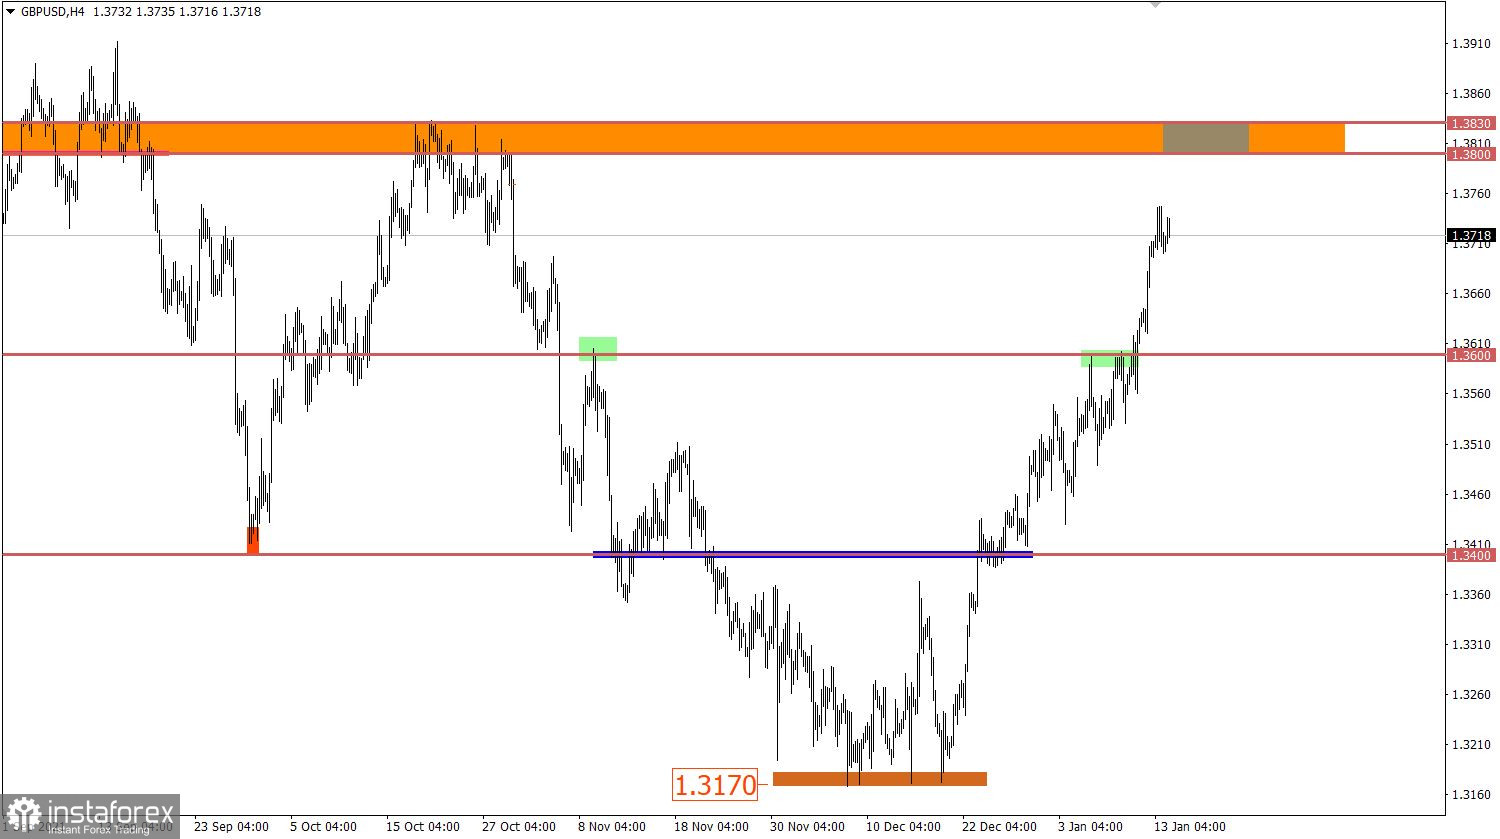
The GBP/USD pair has been rising for the third week in a row, where speculative interest has already led to large-scale price changes. So, the pound strengthened by 550 points, which led to the recovery of the rate relative to the downward trend by more than 50%.
The overbought signal has been repeatedly confirmed in the market, but speculators ignore it. As a result, the price movement was reclassified as inertial.

January 14 economic calendar:
UK's industrial production data was published today at 7:00 Universal time, where their volume increased by 1% in November, which is quite good. However, the pound did not react to this.
Meanwhile, the US retail sales data will be published during the American trading session, where their volume may fall by 0.1% in December. Given that we are dealing with an indicator of consumer spending, a negative figure during the sales season is not the best signal.
Industrial production in the country will also be released, which is expected to rise by 0.4% in December.
Time targeting
Retail sales - 13:30 Universal time
Industrial production - 14:15 Universal time
Trading plan for EUR/USD on January 14:
If the inertial movement on the market is confirmed, the euro rate may further rise to the level of 1.1625. A buy signal will appear when the price holds above the level of 1.1485 in a four-hour period.
An alternative scenario will be considered by traders if a pullback occurs in the market, where a sell signal may occur below the level of 1.1440.
Trading plan for GBP/USD on January 14:
Traders still consider the upward movement as the main one in the market, despite the signals of a possible change in trading interests. So, there will be a new round of growth in the volume of long positions when the price is held above the level of 1.3750. This step will lead to a movement towards the main resistance level of 1.3800, around which the upward cycle is expected to slow down and the price will go into a correction stage.
What is reflected in the trading charts?
A candlestick chart view is graphical rectangles of white and black light, with sticks on top and bottom. When analyzing each candle in detail, you will see its characteristics of a relative period: the opening price, closing price, and maximum and minimum prices.
Horizontal levels are price coordinates, relative to which a stop or a price reversal may occur. These levels are called support and resistance in the market.
Circles and rectangles are highlighted examples where the price of the story unfolded. This color selection indicates horizontal lines that may put pressure on the quote in the future.
The up/down arrows are the reference points of the possible price direction in the future.
*El análisis de mercado publicado aquí tiene la finalidad de incrementar su conocimiento, más no darle instrucciones para realizar una operación.
¡Los informes analíticos de InstaSpot lo mantendrá bien informado de las tendencias del mercado! Al ser un cliente de InstaSpot, se le proporciona una gran cantidad de servicios gratuitos para una operación eficiente.


