


فريقنا لديه أكثر من 7,000,000 من التجار!
كل يوم نعمل معا لتحسين التداول. نحصل على نتائج عالية ونمضي قدما.
الاعتراف من قبل الملايين من التجار في جميع أنحاء العالم هو أفضل تقدير لعملنا! لقد قمت باختيارك وسنفعل كل ما يلزم لتلبية توقعاتك!
نحن فريق رائع معا!
إنستافوركس تعتز بالعمل بالنسبة لك!


الممثل وبطل مسابقة يو إف سي 6 وبطل حقيقي!
الرجل الذي حقق النجاح بعمله الدؤوب. الرجل الذي يذهب كما نريد.
سر نجاح تاكتاروف هو حركة مستمرة نحو الهدف.
اكشف عن جميع جوانب موهبتك!
اكتشف، وحاول، وافشل - ولكن لا تتوقف أبدا!
إنستافوركس. تبدأ قصة نجاحك من هنا!
The number of applications for unemployment benefits in the US reflected a decrease in their total volume.
Statistics details:
The volume of initial applications for benefits increased from 207 thousand to 230 thousand.
The volume of repeated applications for benefits decreased from 1,753 thousand to 1,559 thousand.
The statistics are positive, which reflected the high dynamics of the recovery of the US labor market. However, traders ignored them.
Analysis of trading charts from January 13:
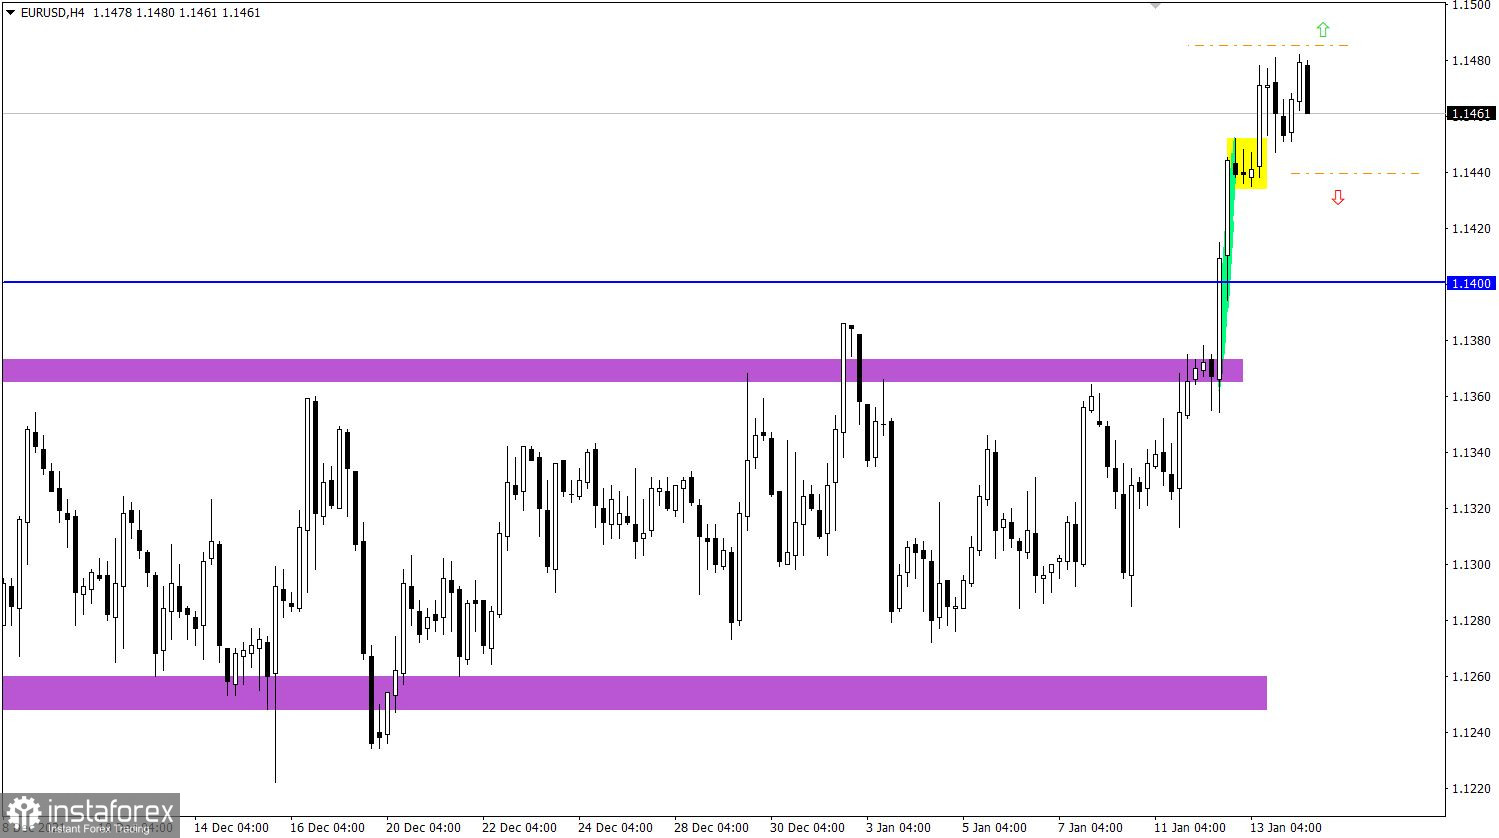
The EUR/USD pair embarked on a cycle of upward inertia after the breakdown of the long-playing side channel, which strengthened the euro by more than 120 points. Despite the growing overbought level, upward interest remains among traders, as indicated by the stepwise course of the price.
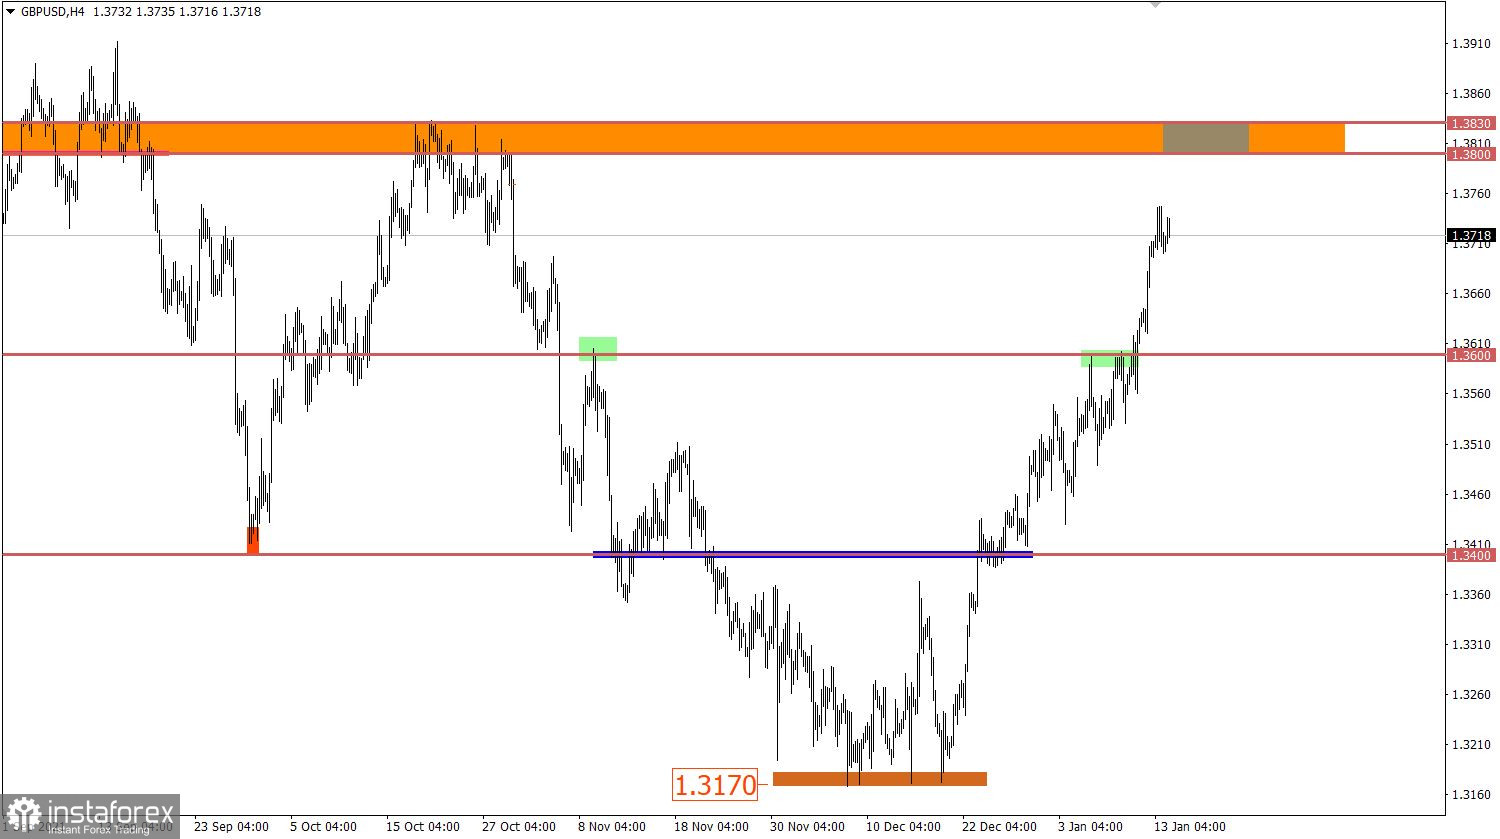
The GBP/USD pair has been rising for the third week in a row, where speculative interest has already led to large-scale price changes. So, the pound strengthened by 550 points, which led to the recovery of the rate relative to the downward trend by more than 50%.
The overbought signal has been repeatedly confirmed in the market, but speculators ignore it. As a result, the price movement was reclassified as inertial.

January 14 economic calendar:
UK's industrial production data was published today at 7:00 Universal time, where their volume increased by 1% in November, which is quite good. However, the pound did not react to this.
Meanwhile, the US retail sales data will be published during the American trading session, where their volume may fall by 0.1% in December. Given that we are dealing with an indicator of consumer spending, a negative figure during the sales season is not the best signal.
Industrial production in the country will also be released, which is expected to rise by 0.4% in December.
Time targeting
Retail sales - 13:30 Universal time
Industrial production - 14:15 Universal time
Trading plan for EUR/USD on January 14:
If the inertial movement on the market is confirmed, the euro rate may further rise to the level of 1.1625. A buy signal will appear when the price holds above the level of 1.1485 in a four-hour period.
An alternative scenario will be considered by traders if a pullback occurs in the market, where a sell signal may occur below the level of 1.1440.
Trading plan for GBP/USD on January 14:
Traders still consider the upward movement as the main one in the market, despite the signals of a possible change in trading interests. So, there will be a new round of growth in the volume of long positions when the price is held above the level of 1.3750. This step will lead to a movement towards the main resistance level of 1.3800, around which the upward cycle is expected to slow down and the price will go into a correction stage.
What is reflected in the trading charts?
A candlestick chart view is graphical rectangles of white and black light, with sticks on top and bottom. When analyzing each candle in detail, you will see its characteristics of a relative period: the opening price, closing price, and maximum and minimum prices.
Horizontal levels are price coordinates, relative to which a stop or a price reversal may occur. These levels are called support and resistance in the market.
Circles and rectangles are highlighted examples where the price of the story unfolded. This color selection indicates horizontal lines that may put pressure on the quote in the future.
The up/down arrows are the reference points of the possible price direction in the future.
*The market analysis posted here is meant to increase your awareness, but not to give instructions to make a trade.
InstaSpot analytical reviews will make you fully aware of market trends! Being an InstaSpot client, you are provided with a large number of free services for efficient trading.


