


¡Nuestro equipo cuenta con más de 7,000,000 operadores!
Cada día, trabajamos juntos para mejorar las operaciones. Obtenemos grandes resultados y seguimos adelante.
El reconocimiento de millones de operadores en todo el mundo es el mejor agradecimiento a nuestro trabajo! ¡Usted hizo su elección y haremos todo lo que esté a nuestro alcance para satisfacer sus expectativas!
¡Juntos somos un gran equipo!
InstaSpot. ¡Orgulloso de trabajar para usted!


¡Actor, 6 veces ganador del torneo UFC y un verdadero héroe!
El hombre que se hizo a sí mismo. El hombre que sigue nuestro camino.
El secreto detrás del éxito de Taktarov es el constante movimiento hacia el objetivo.
¡Revele todo los lados de su talento!
Descubra, intente, fracase, ¡pero nunca se rinda!
InstaSpot. ¡Su historia de éxito comienza aquí!
Gold was trading at 1,841 at the time of writing. The price action developed an up-channel pattern which could represent a downside continuation formation. After its massive drop, the price rebounded and recovered a little. You knew from my previous analyses that the price of gold could register only a temporary rebound.
Technically, the bias is bearish, so temporary growth could bring new selling opportunities. XAU/USD is vulnerable to dropping deeper. The US JOLTS Job Openings, ISM Services PMI, and the Final Services PMI came in better than expected. Also, the FOMC Meeting Minutes confirmed a 50bps or 75bps rate hike in the July meeting.
Tomorrow, the fundamentals could drive the market. The US NFP, Unemployment Rate, and the Average Hourly Earnings will be released.
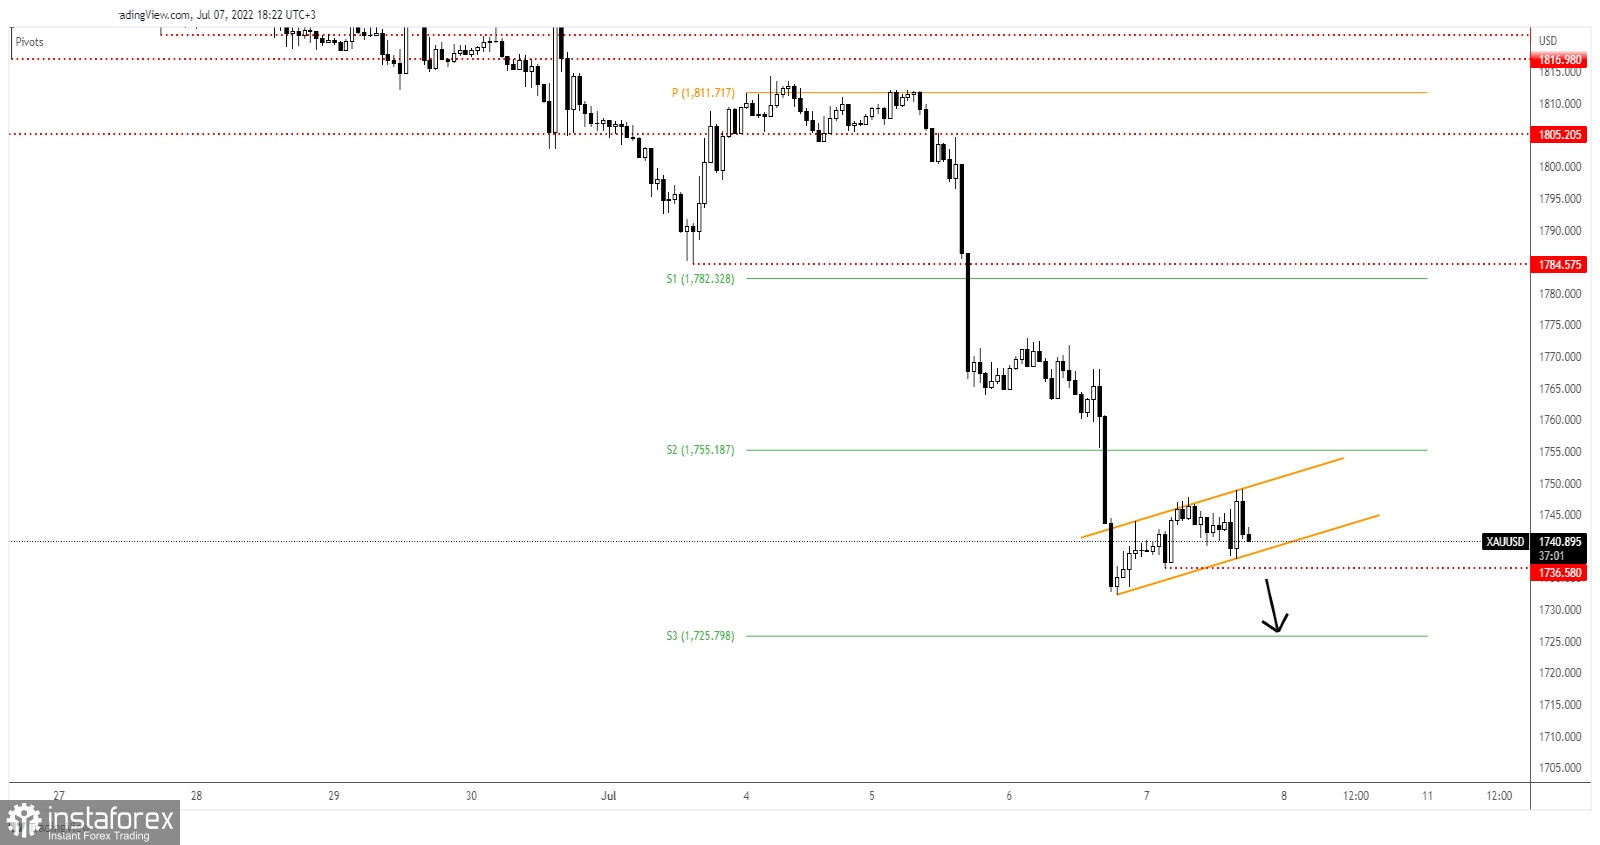
As you can see on the H1 chart, XAU/USD is trapped within an ascending channel pattern. A downside breakout could announce more declines. The price failed to approach and reach the weekly S2 (1,755) which represents an upside obstacle signaling strong selling pressure.
The 1,736 former low stands as static support, while the minor uptrend line represents dynamic support. The resistance is seen at the channel's upside line.
A new lower low, a valid breakdown below the uptrend line and below the 1,736 could validate a potential further drop towards the weekly S3 of 1,725. This scenario could bring new selling opportunities.
*El análisis de mercado publicado aquí tiene la finalidad de incrementar su conocimiento, más no darle instrucciones para realizar una operación.
¡Los informes analíticos de InstaSpot lo mantendrá bien informado de las tendencias del mercado! Al ser un cliente de InstaSpot, se le proporciona una gran cantidad de servicios gratuitos para una operación eficiente.


