


La légende dans l'équipe InstaSpot!
La vraie légende! Vous pensez que c'est trop pathétique? Mais comment pouvez-vous appeler un homme qui, à 18 ans, est devenu le premier champion du monde d'échecs parmi les jeunes hommes d'Asie, et à dix-neuf ans – le premier grand maître de l'histoire de son pays? Ce fut le début de la voie du champion d'échecs –Viswanathan Anand – l'homme qui a inscrit son nom à jamais dans l'histoire des échecs du monde. Une autre légende dans l'équipe d'InstaSpot!


Le FC Borussia est l'un des clubs de football les plus titrés d'Allemagne, qui a prouvé à maintes reprises à ses fans que l'esprit de rivalité et de leadership mènera certainement au succès. Négociez de la même manière que les professionnels du sport mènent le jeu: en toute confiance et activement. Devenez un leader avec le FC Borussia et soyez en tête avec l'équipe InstaSpot!
Gold was trading at 1,841 at the time of writing. The price action developed an up-channel pattern which could represent a downside continuation formation. After its massive drop, the price rebounded and recovered a little. You knew from my previous analyses that the price of gold could register only a temporary rebound.
Technically, the bias is bearish, so temporary growth could bring new selling opportunities. XAU/USD is vulnerable to dropping deeper. The US JOLTS Job Openings, ISM Services PMI, and the Final Services PMI came in better than expected. Also, the FOMC Meeting Minutes confirmed a 50bps or 75bps rate hike in the July meeting.
Tomorrow, the fundamentals could drive the market. The US NFP, Unemployment Rate, and the Average Hourly Earnings will be released.
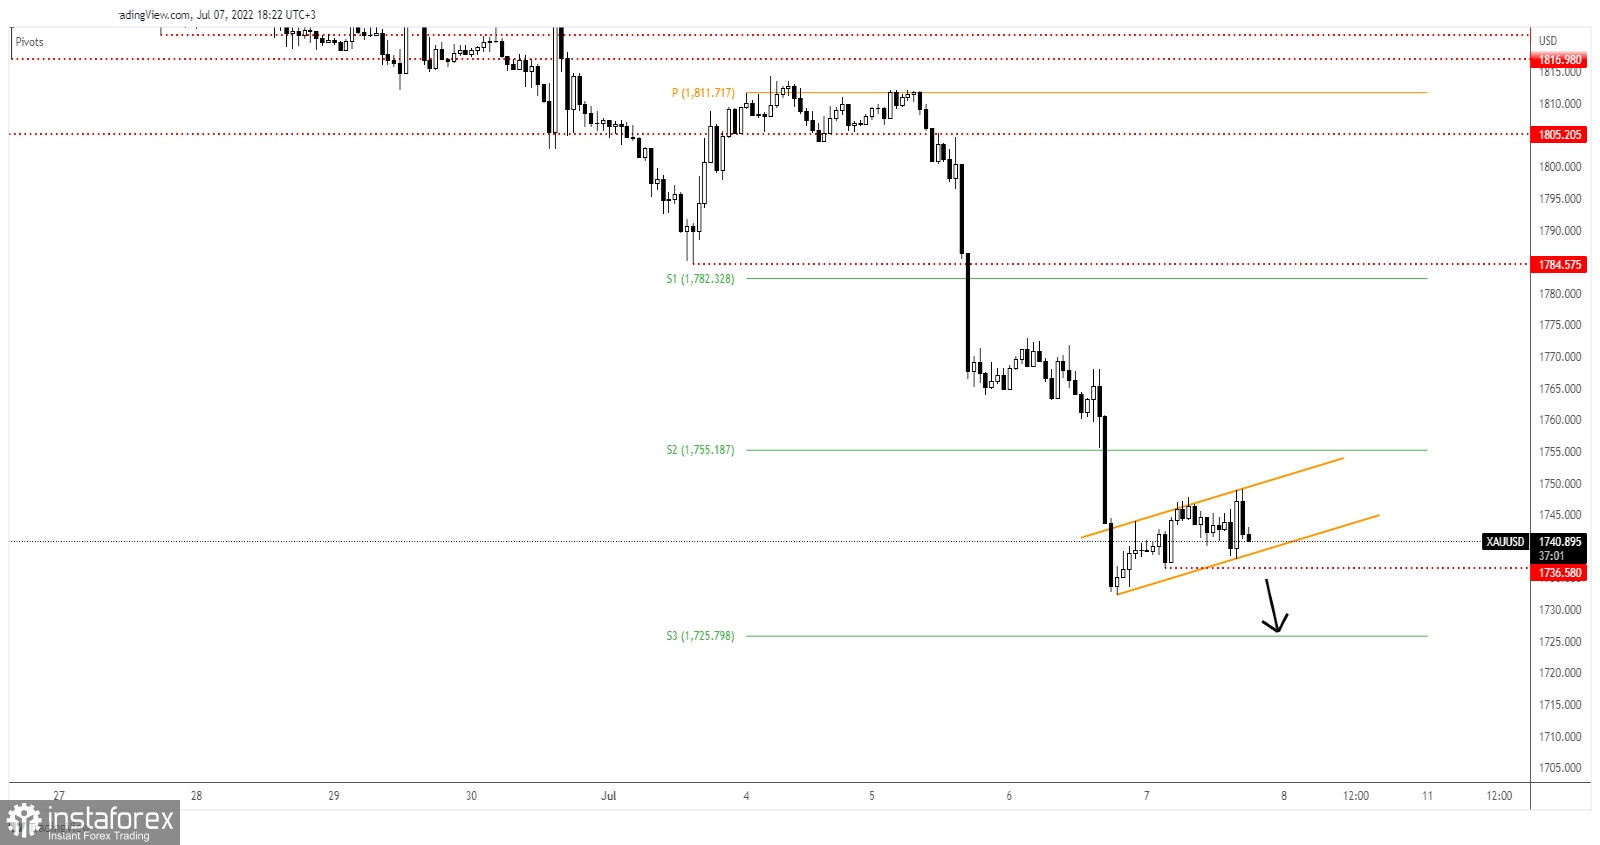
As you can see on the H1 chart, XAU/USD is trapped within an ascending channel pattern. A downside breakout could announce more declines. The price failed to approach and reach the weekly S2 (1,755) which represents an upside obstacle signaling strong selling pressure.
The 1,736 former low stands as static support, while the minor uptrend line represents dynamic support. The resistance is seen at the channel's upside line.
A new lower low, a valid breakdown below the uptrend line and below the 1,736 could validate a potential further drop towards the weekly S3 of 1,725. This scenario could bring new selling opportunities.
*The market analysis posted here is meant to increase your awareness, but not to give instructions to make a trade.
InstaSpot analytical reviews will make you fully aware of market trends! Being an InstaSpot client, you are provided with a large number of free services for efficient trading.


