


¡Nuestro equipo cuenta con más de 7,000,000 operadores!
Cada día, trabajamos juntos para mejorar las operaciones. Obtenemos grandes resultados y seguimos adelante.
El reconocimiento de millones de operadores en todo el mundo es el mejor agradecimiento a nuestro trabajo! ¡Usted hizo su elección y haremos todo lo que esté a nuestro alcance para satisfacer sus expectativas!
¡Juntos somos un gran equipo!
InstaSpot. ¡Orgulloso de trabajar para usted!


¡Actor, 6 veces ganador del torneo UFC y un verdadero héroe!
El hombre que se hizo a sí mismo. El hombre que sigue nuestro camino.
El secreto detrás del éxito de Taktarov es el constante movimiento hacia el objetivo.
¡Revele todo los lados de su talento!
Descubra, intente, fracase, ¡pero nunca se rinda!
InstaSpot. ¡Su historia de éxito comienza aquí!
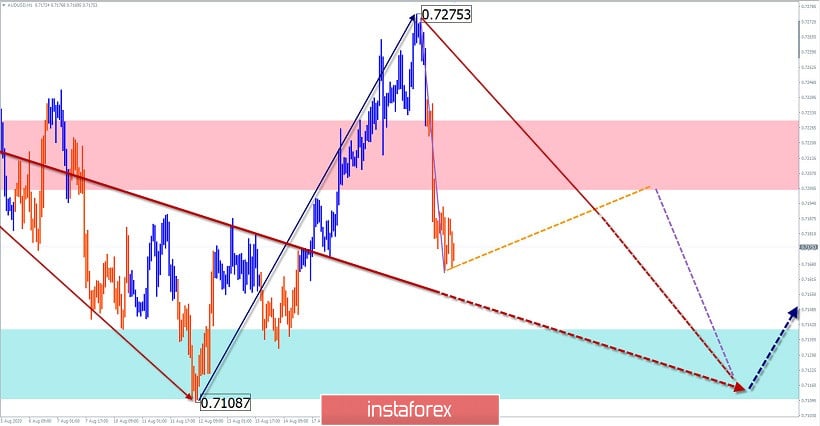
AUD/USD
Analysis:
On the chart of the Australian dollar since March of this year, an upward wave is developing, which sets the trend. The scale of the movement already exceeds the level of the daily time frame. Quotes are now in the area of the reversal zone, forming a correction. It has the shape of a shifting plane and is nearing completion.
Forecast:
Today in the first half of the day, a general downward movement is expected, until the full completion of the entire corrective wave. The probable site of the completion of the design acts as support. Then you should wait for a reversal and the beginning of price growth.
Potential reversal zones
Resistance:
- 0.7200/0.7230
Support:
- 0.7140/0.7110
Recommendations:
Selling the Australian dollar today can be very risky. We recommend that you focus on searching for reversal signals to buy the instrument.
GBP/JPY
Analysis:
The direction of the short-term trend of the cross is set by the downward wave from June 8. In its structure, the middle part (B) is nearing completion. In the last 2 weeks, the quotes are located in the area of the resistance zone of a large TF. Since the end of July, a reversal pattern has been formed on the chart.
Forecast:
In the coming trading sessions, the general downward course of the cross movement is expected. A short-term price rise is not excluded in the European session. The active phase of the decline can be expected in the US session.
Potential reversal zones
Resistance:
- 139.30/139.60
Support:
- 138.30/138.00
Recommendations:
In the pair's market, trading is risky today. Transactions are only possible within the session with a reduced lot. The priority is to sell the tool.

Explanation: In the simplified wave analysis (UVA), waves consist of 3 parts (A-B-C). The last incomplete wave is analyzed. The solid background of arrows shows the formed structure, and the dotted ones show the expected movements.
Note: The wave algorithm does not take into account the duration of the tool movements in time!
*El análisis de mercado publicado aquí tiene la finalidad de incrementar su conocimiento, más no darle instrucciones para realizar una operación.
¡Los informes analíticos de InstaSpot lo mantendrá bien informado de las tendencias del mercado! Al ser un cliente de InstaSpot, se le proporciona una gran cantidad de servicios gratuitos para una operación eficiente.


