


The legend in the InstaSpot team!
Legend! You think that's bombastic rhetoric? But how should we call a man, who became the first Asian to win the junior world chess championship at 18 and who became the first Indian Grandmaster at 19? That was the start of a hard path to the World Champion title for Viswanathan Anand, the man who became a part of history of chess forever. Now one more legend in the InstaSpot team!


Borussia is one of the most titled football clubs in Germany, which has repeatedly proved to fans: the spirit of competition and leadership will certainly lead to success. Trade in the same way that sports professionals play the game: confidently and actively. Keep a "pass" from Borussia FC and be in the lead with InstaSpot!

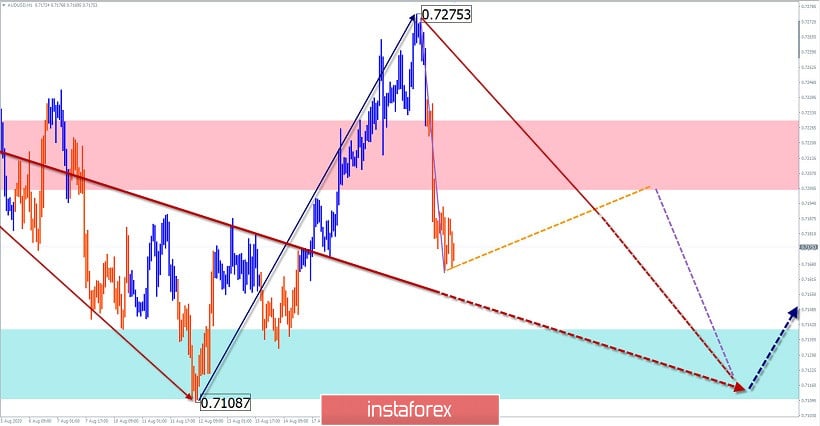
AUD/USD
Analysis:
On the chart of the Australian dollar since March of this year, an upward wave is developing, which sets the trend. The scale of the movement already exceeds the level of the daily time frame. Quotes are now in the area of the reversal zone, forming a correction. It has the shape of a shifting plane and is nearing completion.
Forecast:
Today in the first half of the day, a general downward movement is expected, until the full completion of the entire corrective wave. The probable site of the completion of the design acts as support. Then you should wait for a reversal and the beginning of price growth.
Potential reversal zones
Resistance:
- 0.7200/0.7230
Support:
- 0.7140/0.7110
Recommendations:
Selling the Australian dollar today can be very risky. We recommend that you focus on searching for reversal signals to buy the instrument.
GBP/JPY
Analysis:
The direction of the short-term trend of the cross is set by the downward wave from June 8. In its structure, the middle part (B) is nearing completion. In the last 2 weeks, the quotes are located in the area of the resistance zone of a large TF. Since the end of July, a reversal pattern has been formed on the chart.
Forecast:
In the coming trading sessions, the general downward course of the cross movement is expected. A short-term price rise is not excluded in the European session. The active phase of the decline can be expected in the US session.
Potential reversal zones
Resistance:
- 139.30/139.60
Support:
- 138.30/138.00
Recommendations:
In the pair's market, trading is risky today. Transactions are only possible within the session with a reduced lot. The priority is to sell the tool.

Explanation: In the simplified wave analysis (UVA), waves consist of 3 parts (A-B-C). The last incomplete wave is analyzed. The solid background of arrows shows the formed structure, and the dotted ones show the expected movements.
Note: The wave algorithm does not take into account the duration of the tool movements in time!
*The market analysis posted here is meant to increase your awareness, but not to give instructions to make a trade.
InstaSpot analytical reviews will make you fully aware of market trends! Being an InstaSpot client, you are provided with a large number of free services for efficient trading.


