




Bitcoin has risen a total of $18,000 over the past 10 days. The price easily surpassed the only "bearish" pattern on the daily timeframe. A sell signal was not formed, so the "bearish FVG" pattern is now turning into a "bullish IFVG." However, it should be noted that neither Ethereum nor Bitcoin has broken the downward trends that began last year (the CHOCH lines remain unbroken on the daily timeframe). Thus, regardless of how sharp and strong the current rise is, one should count the chickens before they hatch. In any case, no trading signals have been generated in recent days, and all movement is just another pump. The rise has slowed down and even faded in recent days.
Meanwhile, analysts from CryptoQuant reported that the bearish trend for Bitcoin has ended. Is it too early for such conclusions? Let me remind you that we are not opponents of Bitcoin and its rise to $1 million. However, Bitcoin's $18,000 increase falls within the context of a clear pump, which could very well be manipulation by market makers. The fundamental backdrop for "digital gold" has hardly changed. Nevertheless, CryptoQuant believes that a bullish trend has begun, and confirmation is awaited in the form of a break above the 365-day moving average, currently at $83,000, where Bitcoin has already encountered difficulties.
CryptoQuant also did not rule out a correction from current levels and some selling pressure. It's worth noting that current price levels represent breakeven points for many investors and cost bases for many miners. In simple terms, the current levels look very attractive... for selling. Of course, if the market currently believes in a bullish trend, buyers will overcome selling pressure. But one cannot rule out the possibility of a new wave of selling starting from current positions, rather than buying. In any case, we believe that a small bounce in price is needed relative to the 365-day moving average. CryptoQuant also notes that at current price levels, short-term buyers may begin to take profits.
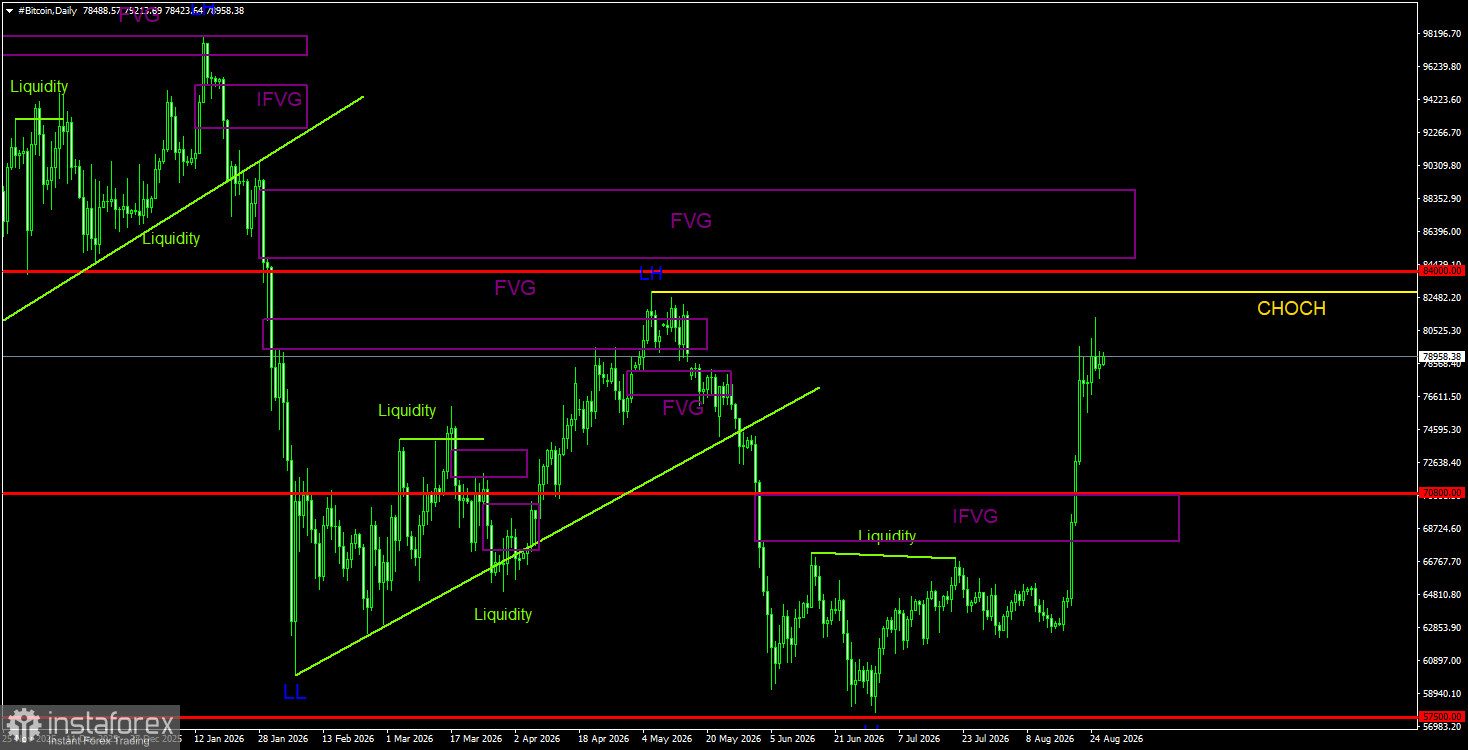
On the daily timeframe, Bitcoin continues to form a downward trend. The trend structure is identified as declining, with the CHOCH line at $82,800, where the last LH (Lower High) was formed. Only above this level can we consider the downward trend complete. The last and only bearish FVG has been fully breached, turning into a bullish IFVG. Thus, this area becomes a POI for long positions in the future. Bitcoin has not yet broken the downward trend, but over the past two weeks, the chances of completing the bearish trend have sharply increased. However, there is a high probability of forming a flat. This means that the price may remove liquidity from the last LH and begin a new decline.
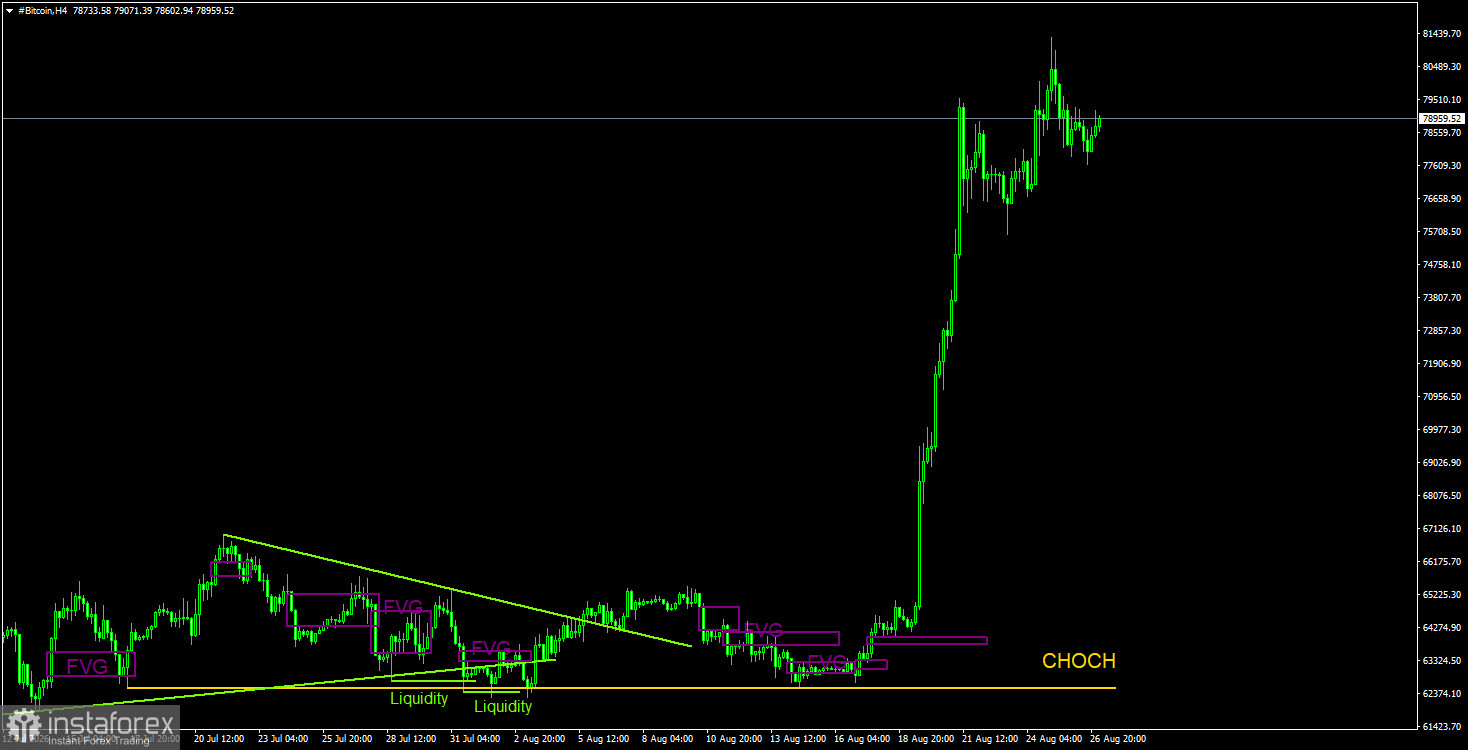
On the 4-hour timeframe, it is clear how Bitcoin has literally soared into space. Analyzing the 4-hour timeframe no longer makes sense, as the movements are too strong. Therefore, signals in the coming days should be sought on the daily or even weekly timeframe.
Bitcoin continues to form a downward trend despite the strong rise this week. We continue to expect a decline, targeting $57,500 (the 61.8% Fibonacci level from a three-year upward trend), even though this level has already been worked out. But we do not believe that the downward trend is complete yet. The last bearish FVG pattern has been canceled, and there are essentially no POI areas for short positions on higher charts. However, on the weekly timeframe, the current rise can be classified as a correction. We understand that the current rise of the first cryptocurrency bears very little resemblance to a correction, but this is not a strong enough reason to open long positions. The current movement resembles pumping without forming patterns or signals. Liquidity can be removed from the $82,850 high, potentially triggering a decline in the first cryptocurrency and confirming a transition to sideways movement.
*تعینات کیا مراد ہے مارکیٹ کے تجزیات یہاں ارسال کیے جاتے ہیں جس کا مقصد آپ کی بیداری بڑھانا ہے، لیکن تجارت کرنے کے لئے ہدایات دینا نہیں.
InstaSpot analytical reviews will make you fully aware of market trends! Being an InstaSpot client, you are provided with a large number of free services for efficient trading.










