




بٹ کوائن نے کل $65,000 سے اوپر جانے کی کوشش کی لیکن اس سطح کو زیادہ دیر تک برقرار رکھنے میں ناکام رہا۔ ایتھریم نے بھی اس کی پیروی کی، پیچھے ہٹنے سے پہلے $1,950 تک پہنچنے کی کوشش کی۔

دریں اثنا، تازہ ترین اعداد و شمار کے مطابق، امریکی اسٹاک ایکسچینج میں درج عوامی کمپنیوں کے پاس موجود بٹ کوائن کے مجموعی ذخائر 12,40,000 بی ٹی سی تک پہنچ چکے ہیں، جو دنیا بھر میں کارپوریٹ اداروں کے پاس موجود بٹ کوائن کے تقریباً 93 فیصد کے برابر ہیں۔ بٹ کوائن مائننگ سٹآک ڈاٹ آئی او کے ٹریکر کے مطابق، جون کے وسط تک عوامی کمپنیوں کے بیلنس شیٹس میں 12,39,968 بی ٹی سی موجود تھے، جو امریکی دائرۂ اختیار میں سرمایہ کے غیر معمولی ارتکاز کی تصدیق کرتے ہیں۔ دوسری جانب، جاپان (جہاں میٹا پلینٹ نمایاں مثال ہے) سمیت دیگر ممالک کے حصے میں مجموعی کارپوریٹ ذخائر کا صرف 7 فیصد آتا ہے۔
گزشتہ ایک سال کے دوران ان کمپنیوں نے مزید 5,10,000 بی ٹی سی خریدے، جو اسی عرصے میں مائنرز کی جانب سے مائن کیے گئے بٹ کوائن کی تعداد سے تین گنا زیادہ ہیں۔ یہ عدم توازن مارکیٹ میں طلب اور رسد کے درمیان ایک گہرے ساختی فرق کی نشاندہی کرتا ہے۔ مائننگ کے ذریعے گردش میں آنے والا ہر نیا بٹ کوائن تقریباً فوری طور پر کارپوریٹ طلب میں جذب ہو جاتا ہے، جبکہ خریداری کی رفتار نئی سپلائی سے تقریباً تین گنا زیادہ ہے۔ اس کا مطلب یہ ہے کہ آزادانہ طور پر دستیاب بٹ کوائن کی حقیقی کمی (سپلائی کا خسارہ) اس رفتار سے بڑھ رہی ہے جو محض نئی مائننگ کی مقدار سے ظاہر نہیں ہوتی۔ یہ صورتحال اس مشاہدے سے بھی مطابقت رکھتی ہے کہ سال کی پہلی سہ ماہی میں عوامی کمپنیوں نے مائنرز کی پیداوار کے مقابلے میں دو گنا سے بھی زیادہ بٹ کوائن جمع کیے تھے، اور پورے سال کے دوران یہ قلت مزید بڑھتی گئی۔
کارپوریٹ اداروں کی جانب سے بٹ کوائن کی اس بڑے پیمانے پر خریداری کو جے پی مارگن کی اس رپورٹ کے تناظر میں بھی دیکھا جانا چاہیے، جس میں مائنرز کی کیپیچیولیشن ، ہیش ریٹ میں کمی اور مائننگ کی مشکل (مائنگ ڈیفی کلٹی) میں گراوٹ کی نشاندہی کی گئی تھی۔ اگر معاشی دباؤ کے باعث مائنرز کم نئے بٹ کوائن پیدا کر رہے ہوں، جبکہ کارپوریٹ طلب نئی سپلائی سے تین گنا زیادہ رفتار سے بڑھ رہی ہو، تو مارکیٹ میں دستیاب بٹ کوائن کی ساختی قلت مزید گہری ہوتی جائے گی، چاہے قلیل مدتی قیمتوں میں اتار چڑھاؤ کیوں نہ آتا رہے۔
اس سے موجودہ مارکیٹ سائیکل میں ایک دلچسپ تضاد پیدا ہوتا ہے۔ بٹ کوائن اپنی تاریخ کے نسبتاً نرم ترین بیئر مارکیٹ ادوار میں سے ایک کا سامنا کر رہا ہے، لیکن اس کی بنیادی وجہ ریٹیل یا ادارہ جاتی سرمایہ کاروں کی قیاس آرائی پر مبنی طلب نہیں، بلکہ یہ ہے کہ کارپوریٹ ادارے دستیاب سپلائی کا مسلسل بڑا حصہ خرید کر اسے عملی طور پر گردش سے باہر نکال رہے ہیں۔
یہ تمام عوامل بٹ کوائن اور اس کی مستقبل میں نئی ریکارڈ بلند ترین سطحوں تک پہنچنے کی صلاحیت کے لیے مثبت سمجھے جا رہے ہیں۔
جہاں تک قلیل مدتی ٹریڈنگ حکمتِ عملی کا تعلق ہے، اس کا منصوبہ اور متعلقہ شرائط ذیل میں بیان کی گئی ہیں۔
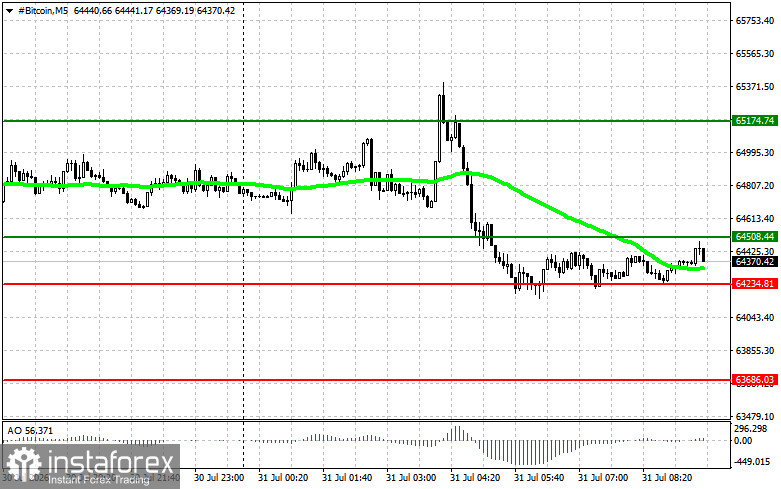
منظر نامہ #1: میں آج Bitcoin خریدنے کا ارادہ رکھتا ہوں جب انٹری پوائنٹ تقریباً $64,500 تک پہنچ جائے گا جس کا ہدف $65,100 تک بڑھ جائے گا۔ میں تقریباً $65,100 پر اپنی خرید پوزیشنوں سے باہر نکلنے اور پل بیک پر فوری فروخت کرنے کا ارادہ رکھتا ہوں۔ بریک آؤٹ پر خریدنے سے پہلے، یقینی بنائیں کہ 50 دن کی موونگ ایوریج موجودہ قیمت سے کم ہے، اور حیرت انگیز اشارے صفر سے اوپر والے زون میں ہے۔منظرنامہ #2: بٹ کوائن خریدنا $64,200 کی نچلی حد سے بھی کیا جا سکتا ہے اگر اس کے بریک آؤٹ پر کوئی مارکیٹ ردعمل نہیں ہے، جس کا مقصد $64,500 اور $65,100 ہے۔
فروخت کا منظر نامہ
منظر نامہ #1: میں $64,200 کی سطح تک پہنچنے کے بعد آج بٹ کوائن فروخت کرنے کا ارادہ رکھتا ہوں جس کے ہدف میں کمی کے ساتھ $63,600 ہو جائے گا۔ میں $63,600 کے آس پاس فروخت کی پوزیشنوں سے باہر نکلنے اور پل بیک پر فوری طور پر خریدنے کا ارادہ رکھتا ہوں۔ بریک آؤٹ پر فروخت کرنے سے پہلے، اس بات کو یقینی بنائیں کہ 50 دن کی موونگ ایوریج موجودہ قیمت سے اوپر ہے، اور حیرت انگیز اشارے صفر سے نیچے کے زون میں ہے۔
منظر نامہ #2: بٹ کوائن کی فروخت $64,500 کی بالائی باؤنڈری سے بھی کی جا سکتی ہے اگر اس کے بریک آؤٹ پر کوئی مارکیٹ ردعمل نہیں ہے، جس کا ہدف $64,200 اور $63,600 ہے۔ایتھریم
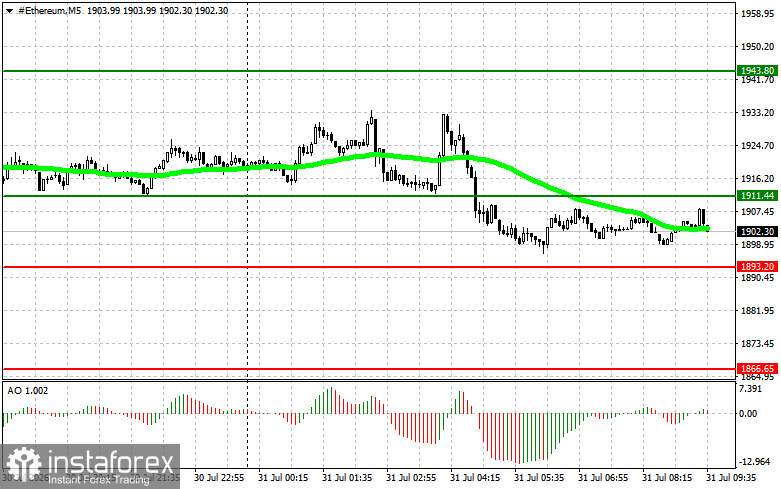
منظر نامہ #1: میں آج ایتھریم خریدنے کا ارادہ رکھتا ہوں جب انٹری پوائنٹ تقریباً $1,911 تک پہنچ جائے گا جس کا ہدف $1,943 تک بڑھ جائے گا۔ میں تقریباً $1,943 پر اپنی خرید پوزیشنوں سے باہر نکلنے اور پل بیک پر فوری فروخت کرنے کا ارادہ رکھتا ہوں۔ بریک آؤٹ پر خریدنے سے پہلے، یقینی بنائیں کہ 50 دن کی موونگ ایوریج موجودہ قیمت سے کم ہے، اور حیرت انگیز اشارے صفر سے اوپر والے زون میں ہے۔
منظر نامہ #2: ایتھریم خریدنا $1,893 کی نچلی حد سے بھی کیا جا سکتا ہے اگر اس کے بریک آؤٹ پر کوئی مارکیٹ ردعمل نہیں ہے، جس کا ہدف $1,911 اور $1,943 ہے۔
منظر نامہ #1: میں آج ایتھرئم کو فروخت کرنے کا ارادہ رکھتا ہوں جب انٹری پوائنٹ تقریباً $1,893 تک پہنچ جائے گا جس کے ہدف میں کمی کے ساتھ $1,866 ہو جائے گا۔ میں تقریباً $1,866 پر فروخت کی پوزیشنوں سے باہر نکلنے اور پل بیک پر فوری طور پر خریدنے کا ارادہ رکھتا ہوں۔ بریک آؤٹ پر فروخت کرنے سے پہلے، اس بات کو یقینی بنائیں کہ 50 دن کی موونگ ایوریج موجودہ قیمت سے اوپر ہے، اور حیرت انگیز اشارے صفر سے نیچے کے زون میں ہے۔
منظر نامہ #2: ایتھریم کی فروخت $1,911 کی بالائی باؤنڈری سے بھی کی جا سکتی ہے اگر اس کے بریک آؤٹ پر کوئی مارکیٹ ردعمل نہیں ہے، جس کا ہدف $1,893 اور $1,866 ہے۔
*تعینات کیا مراد ہے مارکیٹ کے تجزیات یہاں ارسال کیے جاتے ہیں جس کا مقصد آپ کی بیداری بڑھانا ہے، لیکن تجارت کرنے کے لئے ہدایات دینا نہیں.
InstaSpot analytical reviews will make you fully aware of market trends! Being an InstaSpot client, you are provided with a large number of free services for efficient trading.










