


انسٹا فاریکس ٹیم میں لیجنڈ!
لیجنڈ!آپ کو لگتا ہے کہ یہ حیرت انگیز بیانات ہے؟ لیکن ہمیں ایسے شخص کو کیا کہنا چاہئے ، جو 18 سال میں جونیئر ورلڈ شطرنج چیمپئن شپ جیتنے والا پہلا ایشین بن گیا تھا اور 19 میں پہلا ہندوستانی گرینڈ ماسٹر بنا؟ ورلڈ چیمپیئن ٹائٹل کے لئے یہ مشکل آغاز تھا جو وشونااتھ آنند کے لئے تھا ، وہ شخص جو ہمیشہ کے لئے شطرنج کی تاریخ کا حصہ بن گیا تھا۔ انسٹا فاریکس ٹیم میں اب ایک اور لیجنڈ!


Borussia is one of the most titled football clubs in Germany, which has repeatedly proved to fans: the spirit of competition and leadership will certainly lead to success. Trade in the same way that sports professionals play the game: confidently and actively. Keep a "pass" from Borussia FC and be in the lead with InstaSpot!

یورو/امریکی ڈالر کرنسی کے جوڑے کا مقصد پیر کو ایک پرسکون تجارتی دن ہے، لیکن جغرافیائی سیاسی عوامل نے ایک بار پھر مداخلت کی۔ یاد رہے کہ جمعے کے روز ایران اور امریکا کے درمیان مذاکرات میں ایک اور ناکامی کی خبروں نے ڈالر کو مضبوط کیا تھا۔ پیر کے روز یہ اطلاعات سامنے آئیں کہ ایران نے آبنائے ہرمز سے گزرنے کی کوشش کرنے والے ایک امریکی جنگی جہاز پر دو میزائلوں سے حملہ کیا۔ امریکی بحری جہاز کو پہنچنے والے نقصان کی حد معلوم نہیں ہے، لیکن امکان ہے کہ کچھ نقصان ہوا ہے۔ اس طرح ڈالر نے ایک بار پھر نمو ظاہر کی۔ جیسا کہ ہم نے ذکر کیا، امریکی کرنسی جغرافیائی سیاسی عوامل کی وجہ سے مضبوط ہو سکتی ہے۔
تاہم، ڈالر کو مسلسل ترقی کا تجربہ کرنے کے لیے، مشرق وسطیٰ میں تنازعات کو دوبارہ شروع ہونا چاہیے۔ ڈالر کے اب بھی جغرافیائی سیاست کے علاوہ کوئی اور فائدہ نہیں ہے۔
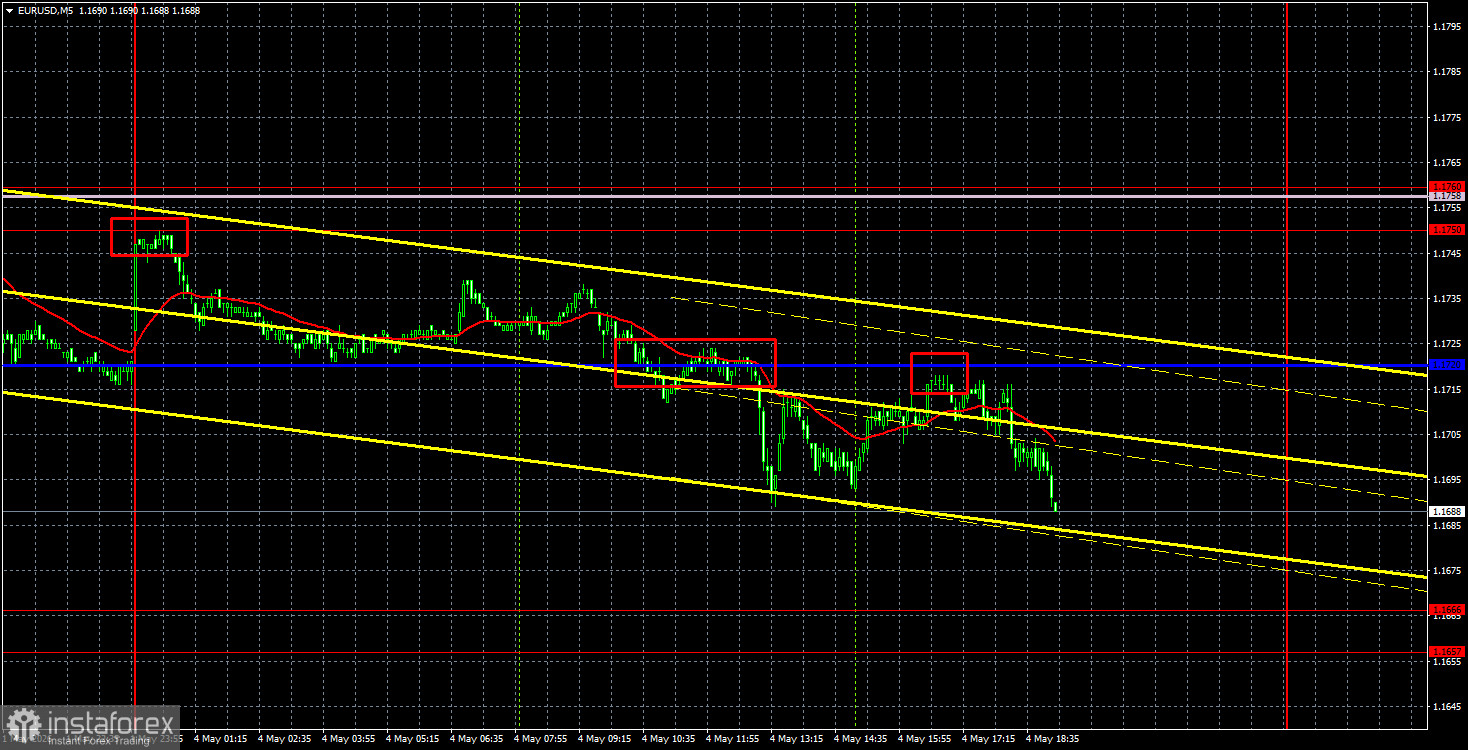
تکنیکی نقطہ نظر سے، ہم ایک فلیٹ یورو/امریکی ڈالر مارکیٹ کا بھی مشاہدہ کرتے ہیں۔ قیمت سینکو اسپین بی لائن اور 1.1750-1.1760 ایریا کے اوپر رکھنے میں ناکام رہی ہے۔ نتیجتاً، 1.1657-1.1666 کے رقبے کی طرف کمی، جو سائیڈ وے چینل کی نچلی حد کے طور پر کام کرتی ہے، اب توقع کی جا سکتی ہے۔ جغرافیائی سیاسی عنصر کے بغیر، بیل بہت جلد مارکیٹ میں واپس آسکتے ہیں۔ یہ بھی واضح رہے کہ اس ہفتے امریکی لیبر مارکیٹ سے متعلق اہم اعداد و شمار پیش کیے گئے ہیں۔
پیر کو 5 منٹ کے ٹائم فریم میں، تین سیل سگنلز بنائے گئے۔ پہلا رات دیر گئے تیار کیا گیا تھا، لہذا بہت کم لوگ اس پر عمل کر سکے۔ دوسرا اس وقت آیا جب یورپی تجارتی سیشن کے دوران اہم لائن کی خلاف ورزی کی گئی۔ تیسرا سگنل امریکی تجارتی سیشن کے دوران Kijun-sen لائن سے اچھالنے کے دوران تھا۔ تاجر مؤخر الذکر دو اشاروں پر عمل کر سکتے ہیں، دوسرا ممکنہ طور پر شام تک منافع میں بند ہو جائے گا یا منگل تک لے جایا جائے گا۔
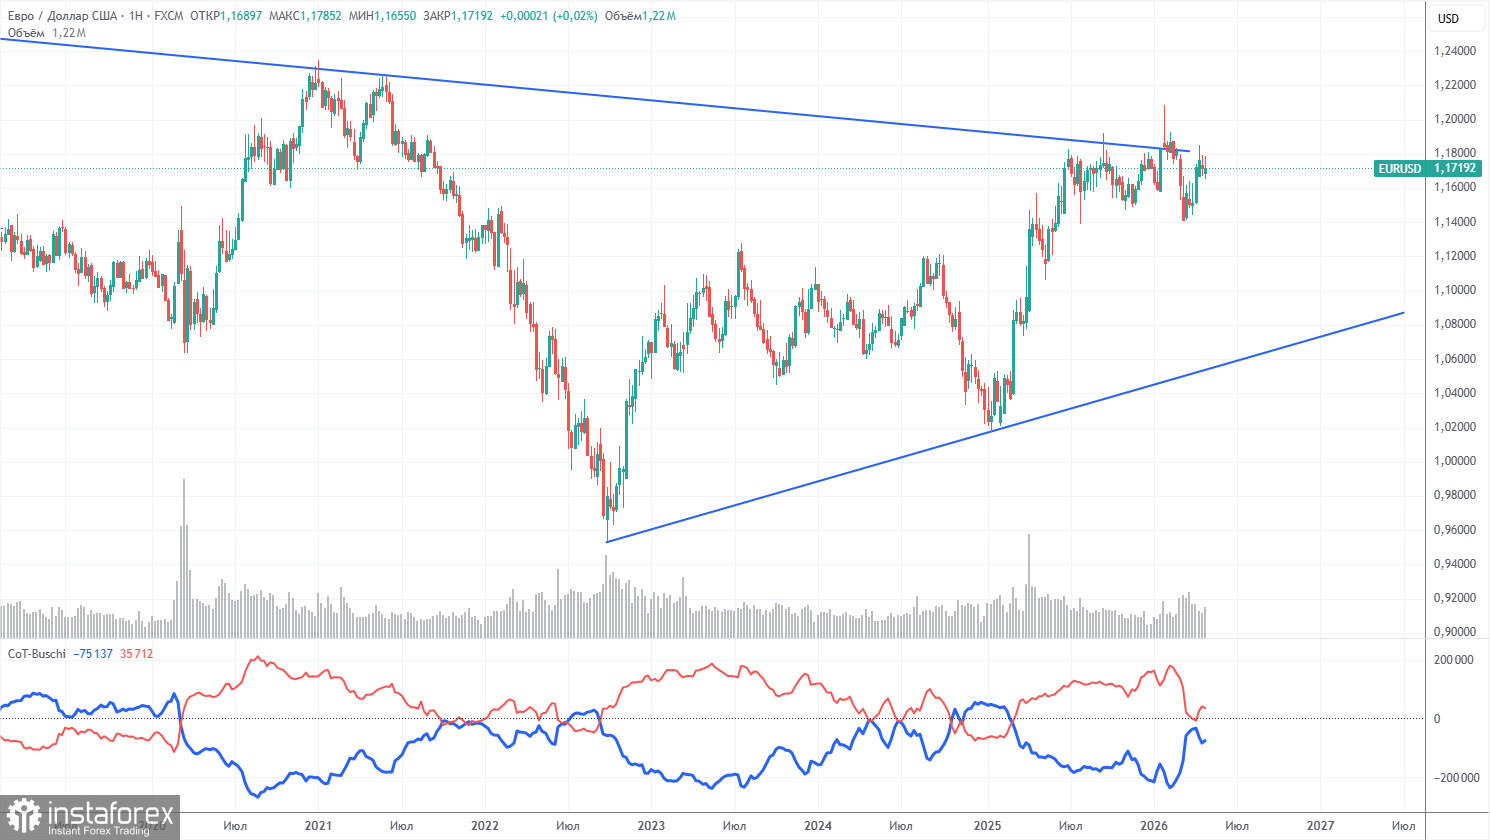
تازہ ترین COT رپورٹ 28 اپریل کی ہے۔ ہفتہ وار ٹائم فریم کی مثال واضح طور پر ظاہر کرتی ہے کہ غیر تجارتی تاجروں کی خالص پوزیشن "تیزی" برقرار ہے، لیکن جغرافیائی سیاسی واقعات کی وجہ سے تیزی سے گر رہی ہے۔ تاجر حالیہ مہینوں میں یورپی کرنسی کو امریکی ڈالر کے حق میں بہا رہے ہیں۔ ٹرمپ کی پالیسیوں میں کوئی تبدیلی نہیں آئی ہے، لیکن کچھ عرصے سے، ڈالر نے "ریزرو کرنسی" کے طور پر کام کیا ہے۔ تاہم، یہ عمل پہلے سے ہی ہمارے پیچھے ہو سکتا ہے.
ہمیں اب بھی کوئی بنیادی عوامل نظر نہیں آتے جو یورو کو مضبوط کریں، جبکہ ڈالر کی کمی کے لیے کافی عوامل باقی ہیں۔ مشرق وسطیٰ میں جنگ نے ڈالر کو عارضی طور پر انتہائی پرکشش بنا دیا، لیکن جب یہ عنصر اپنی "میعاد ختم ہونے کی تاریخ" کو پہنچ جائے گا، تو سب کچھ اسی طرح واپس آجائے گا جیسے پہلے تھا۔ اور اس کی میعاد ختم ہو چکی ہو گی۔ طویل مدتی میں، یورو 1.06 (ٹرینڈ لائن) کی سطح تک گر سکتا ہے، لیکن اوپر کا رجحان اب بھی متعلقہ رہے گا۔ فی الحال، جوڑی اترتی ہوئی ٹرینڈ لائن سے بہت دور نہیں بھٹکی ہے، جس کی کئی بار خلاف ورزی کی جا چکی ہے۔
اشارے کی سرخ اور نیلی لکیروں کی پوزیشننگ بیل اور ریچھ کے درمیان برابری کی نشاندہی کرتی ہے۔ گزشتہ رپورٹنگ ہفتے کے دوران، "نان کمرشل" گروپ میں لمبی پوزیشنوں کی تعداد میں 300 کی کمی ہوئی، جبکہ شارٹس کی تعداد میں 5,300 کا اضافہ ہوا۔ نتیجتاً، خالص پوزیشن میں ہفتے کے دوران 5,600 معاہدوں کی کمی واقع ہوئی۔
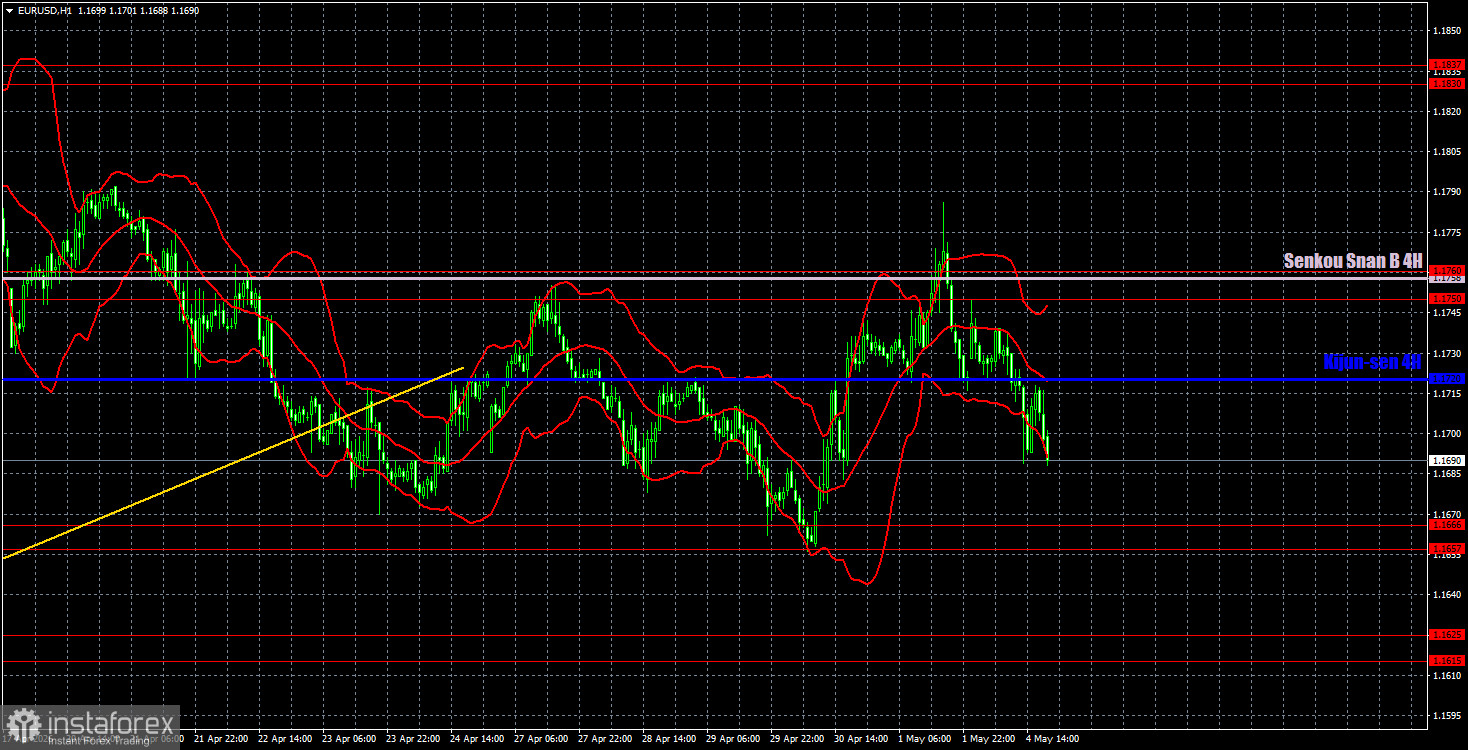
فی گھنٹہ ٹائم فریم پر، یورو/امریکی ڈالر کا جوڑا نیچے کی طرف رجحان بنا رہا ہے، لیکن حقیقت میں، ہم ایک فلیٹ مارکیٹ کا مشاہدہ کر رہے ہیں۔ مشرق وسطیٰ کی صورتحال بدستور کشیدہ ہے، لیکن یہ بگڑ نہیں رہی ہے، اس لیے فی الحال امریکی ڈالر کو مزید مضبوط کرنے کی چند مضبوط وجوہات ہیں۔ تکنیکی طور پر، ڈالر یورو کے مقابلے میں زیادہ فائدہ مند پوزیشن میں ہے، لیکن یہ فائدہ گزشتہ ہفتے محسوس نہیں کیا گیا تھا۔
5 مئی کے لیے، ہم مندرجہ ذیل تجارتی سطحوں کو نمایاں کرتے ہیں: 1.1362, 1.1426, 1.1542, 1.1615-1.1625, 1.1657-1.1666, 1.1750-1.1760, 1.1830-1.1819, 1.1830-1.1819, سینکو اسپین بی لائن (1.1758) اور کیجن سین لائن (1.1720)۔ Ichimoku اشارے کی لکیریں دن بھر بدل سکتی ہیں، جنہیں ٹریڈنگ سگنلز کا تعین کرتے وقت دھیان میں رکھنا چاہیے۔ یاد رکھیں کہ اگر قیمت 15 پِپس تک درست سمت میں بڑھ جاتی ہے تو بریک ایون کے لیے سٹاپ لاس سیٹ کرنا یاد رکھیں۔ اگر سگنل غلط نکلے تو اس سے ممکنہ نقصانات سے حفاظت میں مدد ملے گی۔
منگل کو، یورپی مرکزی بینک کی صدر کرسٹین لیگارڈ یورو زون میں ایک اور تقریر کریں گی، اور ہمیں ابھی بھی ان سے کسی اہم بیان کی توقع نہیں ہے۔ امریکہ میں، ایک اہم ISM سروسز سیکٹر ایکٹیویٹی انڈیکس جاری کیا جائے گا، اس کے ساتھ ملازمت کے مواقع پر کم اہم JOLTs رپورٹ بھی جاری کی جائے گی۔ جغرافیائی سیاست کے بارے میں مت بھولنا۔
آج، تاجر مختصر پوزیشنز کھول سکتے ہیں اگر قیمت 1.1657-1.1666 ایریا سے نیچے مضبوط ہو جائے، جس کا ہدف 1.1615-1.1625 ہے۔ Kijun-sen لائن اور Senkou Span B لائن پر اہداف کے ساتھ 1.1657-1.1666 کے علاقے سے قیمتوں میں اضافے پر لمبی پوزیشنیں کھولی جا سکتی ہیں۔
سپورٹ اور مزاحمتی قیمت کی سطحیں (مزاحمت/سپورٹ) - موٹی سرخ لکیریں جن کے گرد حرکت ختم ہو سکتی ہے۔ وہ تجارتی سگنل کے ذرائع نہیں ہیں۔
Kijun-sen اور Senkou Span B لائنیں - Ichimoku اشارے کی لائنیں چار گھنٹے سے گھنٹہ وار ٹائم فریم میں منتقل ہوتی ہیں۔ وہ مضبوط لکیریں ہیں۔
انتہا کی سطحیں - وہ پتلی سرخ لکیریں جہاں سے قیمت پہلے بڑھی تھی۔ وہ تجارتی سگنل کے ذرائع ہیں۔
پیلی لکیریں - ٹرینڈ لائنز، ٹرینڈ چینلز، اور کوئی اور تکنیکی پیٹرن۔
COT چارٹس پر انڈیکیٹر 1 – تاجروں کے ہر زمرے کی خالص پوزیشن کا سائز۔
*تعینات کیا مراد ہے مارکیٹ کے تجزیات یہاں ارسال کیے جاتے ہیں جس کا مقصد آپ کی بیداری بڑھانا ہے، لیکن تجارت کرنے کے لئے ہدایات دینا نہیں.
InstaSpot analytical reviews will make you fully aware of market trends! Being an InstaSpot client, you are provided with a large number of free services for efficient trading.


