


ہمارے ٹیم میں 7000000 سے ذائد تاجران شامل ہیں
ہم تجارت کی بہتری کے لئے ہر روز اکھٹے کام کرتے ہیں اور بہترین نتائج حاصل کرتے ہوئے آگے کی جانب بڑھتے ہیں
دُنیا بھر سے سے لاکھوں ہمارے بہترین کام کو سند عطاء کرتے ہیں آپ اپنا انتحاب کریں باقی ہم آپ کی توقعات پر پورا اترنے کے لئے اپنی بہترین کوشش کریں گے
ہم مل کر ایک بہترین ٹیم بناتے ہیں
انسٹا فاریکس آپ سے کام کرتے ہوئے فخر محسوس کرتا ہے


ایکٹر - یو سی ایف 6 ٹورنامنٹ چیمپین اور واقعی ہیرو
ایک فرد کے جس نے اپنا آپ منوایا ہے وہ فرد کہ جو ہماری راہ پر چلا ہے.
ٹکٹا روو کی کامیابی کا راز یہ ہے کہ وہ اپنے اہداف کی جانب مسلسل بڑھتا رہتا ہے
اپنے ہنر یا ٹیلنٹ کے تمام پہلو آشکار کررہے ہیں
پہچانیں ، کوشش کریں ، ناکام ہوں لیکن کبھی نہ رُکیں
انسٹا فاریکس آپ کی کامیابی کی کہاں یہاں سے شروع ہوتی ہے

The USD/JPY pair dropped a little in the short term but the bias remains bullish. It's trading at 140.28 at the time of writing far below 140.91 today's high. Temporary retreats could bring us new longs.
Fundamentally, the US and Japanese economic data came in mixed on Friday. In the short term, the rate could test and retest the near-term support levels before jumping higher. Still, it remains to see how it reacts tomorrow. The Japanese Unemployment Claims could drop from 2.8% to 2.7%, while the US CB Consumer Confidence is expected at 99.1 points versus 101.3 points estimated.
The US data could be decisive during the week. The NFP, Average Hourly Earnings, Unemployment Rate, ADP Non-Farm Employment Change, ISM Manufacturing PMI, and JOLTS Job Openings could really shake the markets.
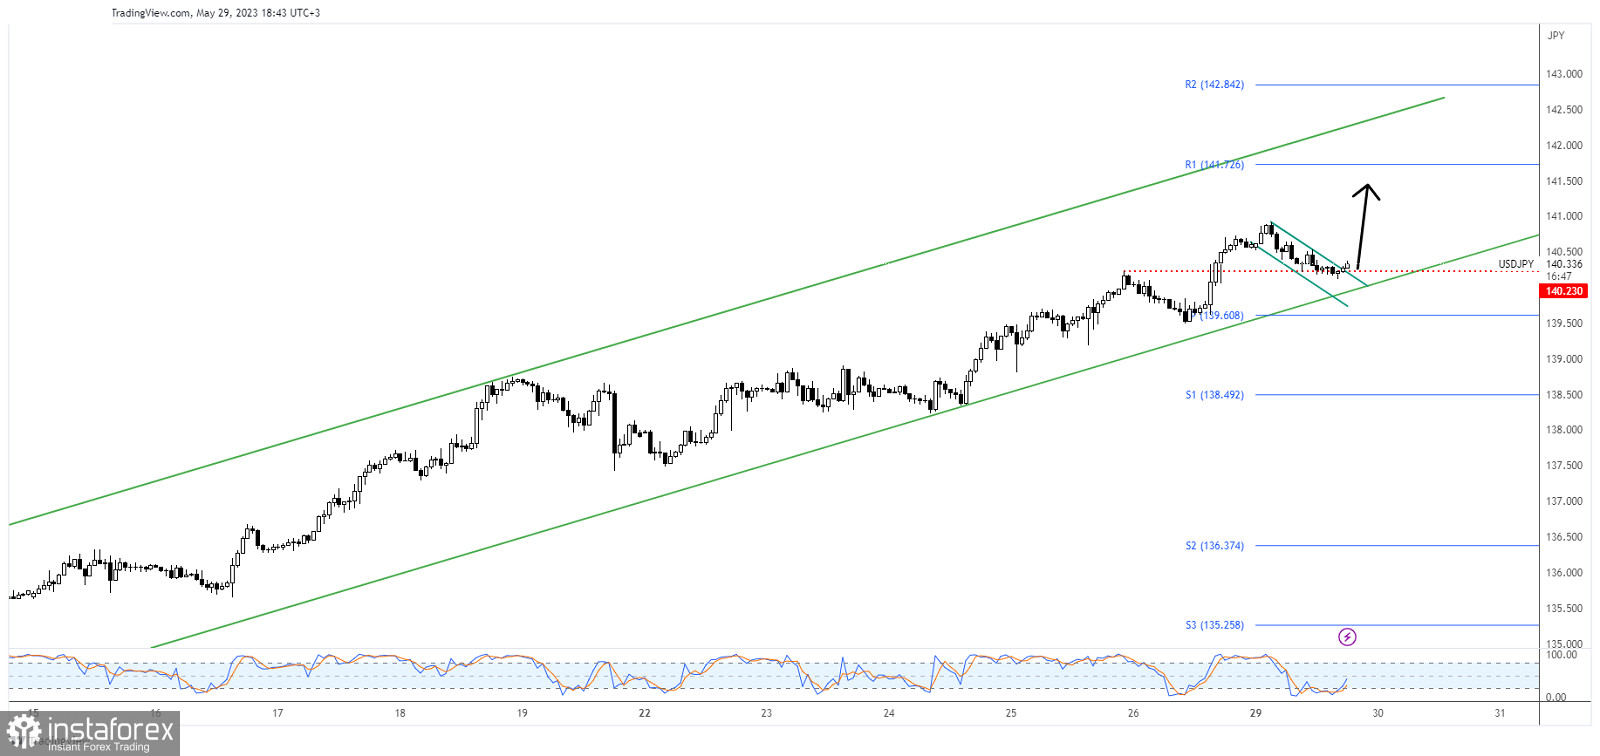
As you can see on the H1 chart, USD/JPY dropped a little within a minor down channel. Now, it has found support on the 140.23 former high and it tries to come back higher. The bias remains bullish as long as it stays above the uptrend line.
Technically, the minor retreat represented a flag pattern which is seen as a bullish formation. After the previous rally, a minor retreat was natural.
Escaping from the minor flag may announce a new bullish momentum. Testing and retesting 140.23, consolidation above the immediate support levels should bring new longs. False breakdowns below 140.23 and under the lower median line (lml) could represent buying signals. The weekly R1 (141.72) represents an upside target if the rate continues to grow.
*تعینات کیا مراد ہے مارکیٹ کے تجزیات یہاں ارسال کیے جاتے ہیں جس کا مقصد آپ کی بیداری بڑھانا ہے، لیکن تجارت کرنے کے لئے ہدایات دینا نہیں.
InstaSpot analytical reviews will make you fully aware of market trends! Being an InstaSpot client, you are provided with a large number of free services for efficient trading.


